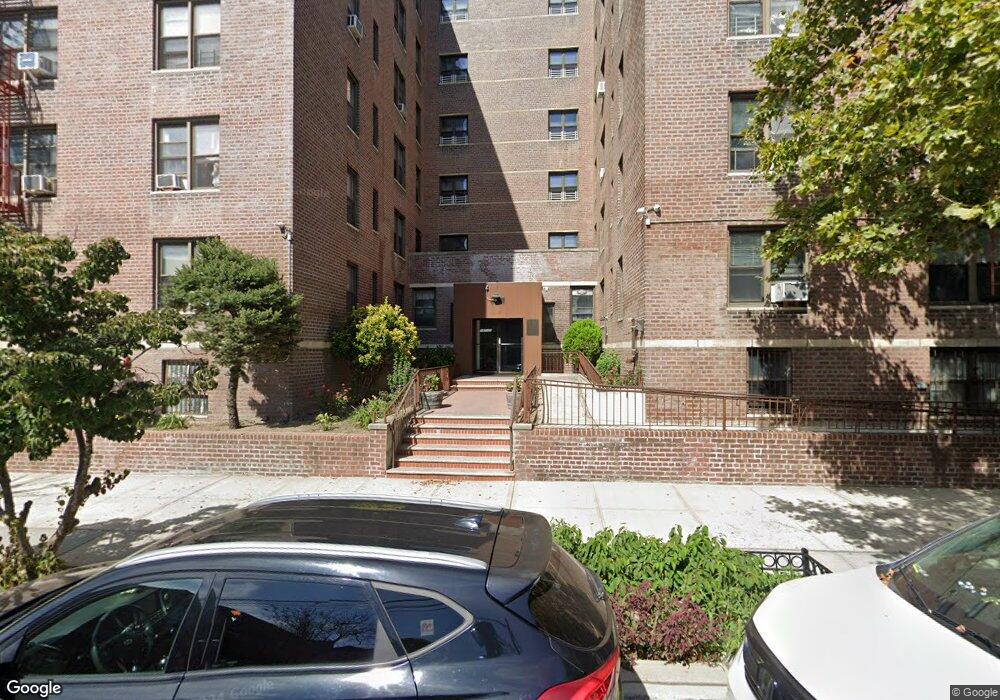
14737 Roosevelt Ave Unit 4D Flushing, NY 11354
Flushing NeighborhoodEstimated Value: $442,806 - $498,000
--
Bed
--
Bath
742
Sq Ft
$628/Sq Ft
Est. Value
About This Home
This home is located at 14737 Roosevelt Ave Unit 4D, Flushing, NY 11354 and is currently estimated at $465,702, approximately $627 per square foot. 14737 Roosevelt Ave Unit 4D is a home located in Queens County with nearby schools including P.S. 32 - State Street, Flushing High School, and Flushing Christian School.
Ownership History
Date
Name
Owned For
Owner Type
Purchase Details
Closed on
Jul 2, 2004
Sold by
Wong Teresa
Bought by
Lam Deanna K and Lam Walter K
Current Estimated Value
Home Financials for this Owner
Home Financials are based on the most recent Mortgage that was taken out on this home.
Original Mortgage
$50,000
Interest Rate
6.25%
Mortgage Type
Purchase Money Mortgage
Purchase Details
Closed on
Dec 18, 1995
Sold by
Kao Yu Chin Shao
Bought by
Wong Teresa
Purchase Details
Closed on
Dec 1, 1993
Sold by
Manhattan Real Estate Holdings Inc
Bought by
Kao Yu Chin Shao
Home Financials for this Owner
Home Financials are based on the most recent Mortgage that was taken out on this home.
Original Mortgage
$27,500
Interest Rate
6.82%
Mortgage Type
Purchase Money Mortgage
Create a Home Valuation Report for This Property
The Home Valuation Report is an in-depth analysis detailing your home's value as well as a comparison with similar homes in the area
Home Values in the Area
Average Home Value in this Area
Purchase History
| Date | Buyer | Sale Price | Title Company |
|---|---|---|---|
| Lam Deanna K | $211,000 | -- | |
| Wong Teresa | $69,000 | -- | |
| Kao Yu Chin Shao | -- | -- |
Source: Public Records
Mortgage History
| Date | Status | Borrower | Loan Amount |
|---|---|---|---|
| Previous Owner | Lam Deanna K | $50,000 | |
| Previous Owner | Kao Yu Chin Shao | $27,500 |
Source: Public Records
Tax History Compared to Growth
Tax History
| Year | Tax Paid | Tax Assessment Tax Assessment Total Assessment is a certain percentage of the fair market value that is determined by local assessors to be the total taxable value of land and additions on the property. | Land | Improvement |
|---|---|---|---|---|
| 2025 | $3,894 | $31,394 | $2,574 | $28,820 |
| 2024 | $2,800 | $31,145 | $2,574 | $28,571 |
| 2023 | $3,753 | $30,020 | $2,574 | $27,446 |
| 2022 | $2,607 | $29,713 | $2,574 | $27,139 |
| 2021 | $2,478 | $28,096 | $2,574 | $25,522 |
| 2020 | $1,675 | $32,115 | $2,574 | $29,541 |
| 2019 | $3,581 | $31,419 | $2,574 | $28,845 |
| 2018 | $3,395 | $26,694 | $2,575 | $24,119 |
| 2017 | $3,146 | $24,734 | $2,574 | $22,160 |
| 2016 | $3,063 | $24,734 | $2,574 | $22,160 |
| 2015 | $1,686 | $22,795 | $2,574 | $20,221 |
| 2014 | $1,686 | $21,713 | $2,574 | $19,139 |
Source: Public Records
Map
Nearby Homes
- 147-37 Roosevelt Ave Unit 2C
- 147-26 Roosevelt Ave Unit L1
- 38-15 149th St Unit 1S
- 38-15 149th St Unit 3V
- 38-15 149th St Unit 1G
- 38-15 149th St Unit 6H
- 38-15 149th St Unit 1A
- 38-15 149th St Unit 3C
- 147- 25 38th Ave Unit F26
- 38-08 147th St Unit 2F
- 38-08 147th St Unit 6E
- 38-08 147 St Unit C2
- 147-37 38th Ave Unit C66
- 144-85 Roosevelt Ave Unit 5E
- 14737 38th Ave Unit C23
- 14737 38th Ave Unit C54
- 14737 38th Ave Unit C48
- 147-31 38th Ave Unit A68
- 147-31 38th Ave Unit A33
- 147-31 38th Ave Unit A66
- 14737 Roosevelt Ave Unit 5F
- 14737 Roosevelt Ave Unit 6H
- 14737 Roosevelt Ave Unit 6G
- 14737 Roosevelt Ave Unit 6F
- 14737 Roosevelt Ave Unit 6E
- 14737 Roosevelt Ave Unit 6D
- 14737 Roosevelt Ave Unit 6C
- 14737 Roosevelt Ave Unit 6B
- 14737 Roosevelt Ave Unit 6A
- 14737 Roosevelt Ave Unit 5H
- 14737 Roosevelt Ave Unit 5G
- 14737 Roosevelt Ave Unit 5E
- 14737 Roosevelt Ave Unit 5D
- 14737 Roosevelt Ave Unit 5C
- 14737 Roosevelt Ave Unit 5B
- 14737 Roosevelt Ave Unit 4H
- 14737 Roosevelt Ave Unit 4G
- 14737 Roosevelt Ave Unit 4F
- 14737 Roosevelt Ave Unit 4E
- 14737 Roosevelt Ave Unit 4C