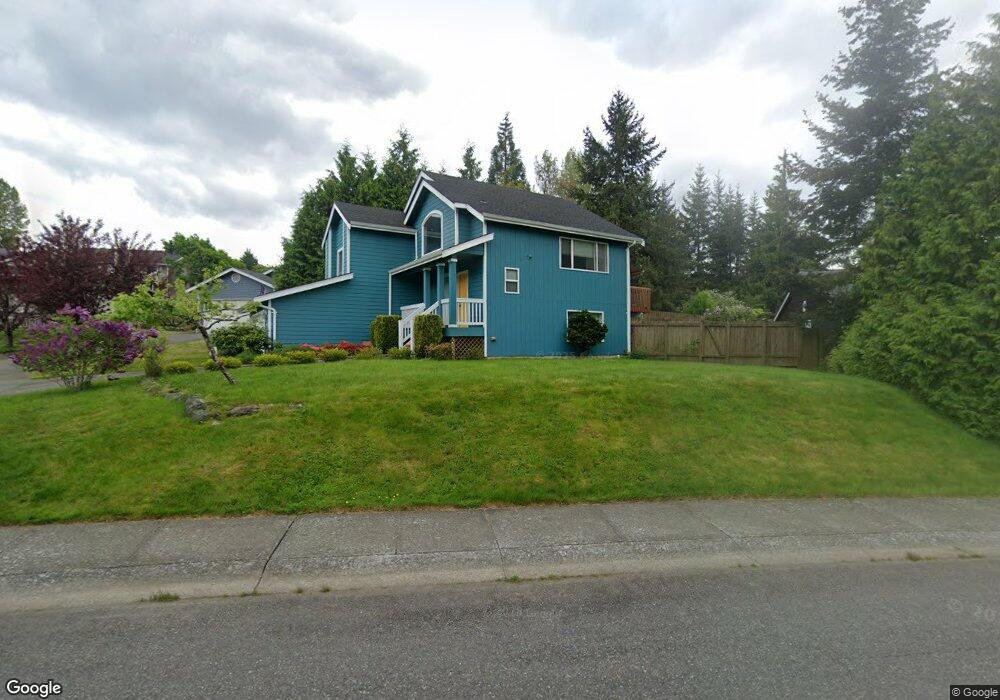
1475 Roma Rd Bellingham, WA 98226
Estimated Value: $659,000 - $724,000
3
Beds
2
Baths
1,478
Sq Ft
$466/Sq Ft
Est. Value
About This Home
This home is located at 1475 Roma Rd, Bellingham, WA 98226 and is currently estimated at $689,214, approximately $466 per square foot. 1475 Roma Rd is a home located in Whatcom County with nearby schools including Northern Heights Elementary School, Shuksan Middle School, and Squalicum High School.
Ownership History
Date
Name
Owned For
Owner Type
Purchase Details
Closed on
Aug 6, 2013
Sold by
Smeall Kevin
Bought by
Clynch Cecilia Marie and Albert James David
Current Estimated Value
Home Financials for this Owner
Home Financials are based on the most recent Mortgage that was taken out on this home.
Original Mortgage
$210,000
Outstanding Balance
$52,491
Interest Rate
4.46%
Mortgage Type
New Conventional
Estimated Equity
$636,723
Purchase Details
Closed on
Nov 18, 2008
Sold by
Ankeny Jason E
Bought by
Smeall Kevin
Home Financials for this Owner
Home Financials are based on the most recent Mortgage that was taken out on this home.
Original Mortgage
$261,548
Interest Rate
5.9%
Mortgage Type
FHA
Purchase Details
Closed on
Apr 11, 2001
Sold by
Ehrlich John H
Bought by
Ankeny Jason E
Home Financials for this Owner
Home Financials are based on the most recent Mortgage that was taken out on this home.
Original Mortgage
$158,000
Interest Rate
7.09%
Mortgage Type
VA
Create a Home Valuation Report for This Property
The Home Valuation Report is an in-depth analysis detailing your home's value as well as a comparison with similar homes in the area
Home Values in the Area
Average Home Value in this Area
Purchase History
| Date | Buyer | Sale Price | Title Company |
|---|---|---|---|
| Clynch Cecilia Marie | $280,280 | Chicago Title Insurance | |
| Smeall Kevin | $265,280 | Chicago Title Insurance | |
| Ankeny Jason E | $135,808 | Chicago Title Insurance |
Source: Public Records
Mortgage History
| Date | Status | Borrower | Loan Amount |
|---|---|---|---|
| Open | Clynch Cecilia Marie | $210,000 | |
| Previous Owner | Smeall Kevin | $261,548 | |
| Previous Owner | Ankeny Jason E | $158,000 |
Source: Public Records
Tax History Compared to Growth
Tax History
| Year | Tax Paid | Tax Assessment Tax Assessment Total Assessment is a certain percentage of the fair market value that is determined by local assessors to be the total taxable value of land and additions on the property. | Land | Improvement |
|---|---|---|---|---|
| 2024 | $5,052 | $574,642 | $242,352 | $332,290 |
| 2023 | $5,052 | $599,916 | $253,011 | $346,905 |
| 2022 | $4,028 | $487,736 | $205,700 | $282,036 |
| 2021 | $3,834 | $403,088 | $170,000 | $233,088 |
| 2020 | $3,741 | $361,155 | $132,405 | $228,750 |
| 2019 | $3,332 | $337,442 | $123,803 | $213,639 |
| 2018 | $3,454 | $302,664 | $111,053 | $191,611 |
| 2017 | $3,010 | $267,799 | $98,260 | $169,539 |
| 2016 | $2,782 | $243,393 | $89,420 | $153,973 |
| 2015 | $2,966 | $231,851 | $85,000 | $146,851 |
| 2014 | -- | $240,549 | $87,720 | $152,829 |
| 2013 | -- | $230,517 | $85,000 | $145,517 |
Source: Public Records
Map
Nearby Homes
- 1368 Roma Rd
- 1430 Welling Rd
- 1314 Welling Rd
- 3871 Cindy Ln
- 1379 Northwood Ct
- 3785 Greenville Place
- 3827 Keystone Way
- 3606 Tree Farm Ct
- 3817 E Sunset Dr
- 3715 E Sunset Dr
- 4121 Malachite Dr
- 4136 Malachite Dr
- 1580 Hillsdale Rd
- 3713 Bristol St
- 3709 Bristol St
- 1756 Emerald Lake Way
- 1812 Squalicum Mountain Rd
- 3001 E Sunset Dr
- 1430 Mt Baker Hwy
- 3666 Woodlake Rd