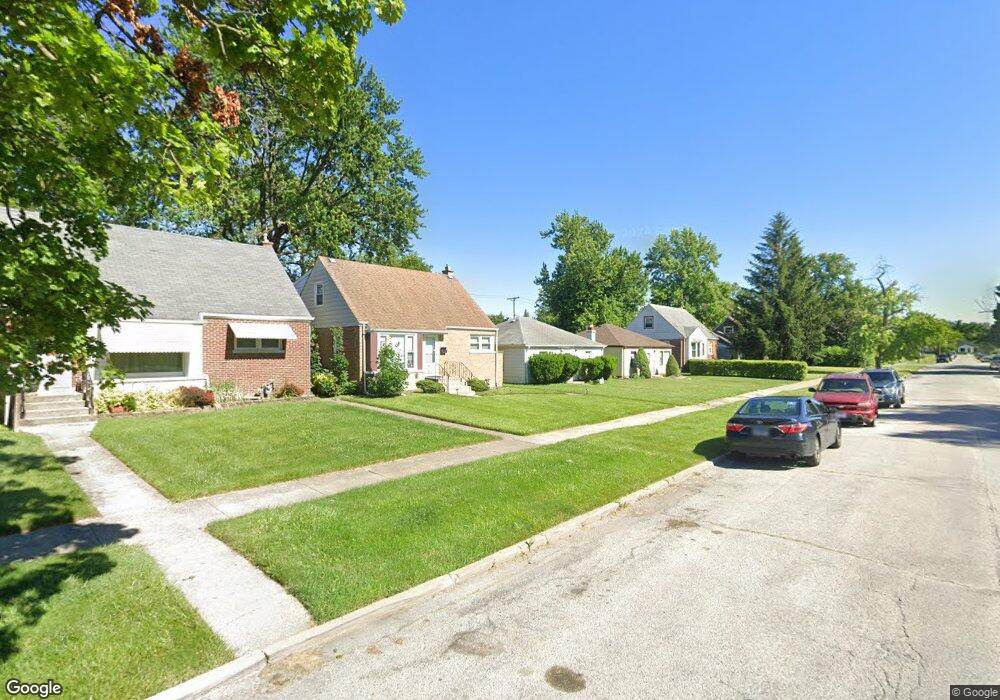
1477 Forest Ave Calumet City, IL 60409
Estimated Value: $106,000 - $156,000
3
Beds
1
Bath
1,000
Sq Ft
$132/Sq Ft
Est. Value
About This Home
This home is located at 1477 Forest Ave, Calumet City, IL 60409 and is currently estimated at $131,667, approximately $131 per square foot. 1477 Forest Ave is a home located in Cook County with nearby schools including Hoover Elementary School, Schrum Memorial Middle School, and Thornton Fractional North High School.
Ownership History
Date
Name
Owned For
Owner Type
Purchase Details
Closed on
Dec 6, 2017
Sold by
Jca Fund 11 Llc Series 1477
Bought by
Gca Investments Llc
Current Estimated Value
Purchase Details
Closed on
Jun 15, 2015
Sold by
Wimes Riley
Bought by
Jca Fund 11 Llc Series 1477
Purchase Details
Closed on
Oct 31, 2008
Sold by
Biel Mary
Bought by
Wimes Riley
Home Financials for this Owner
Home Financials are based on the most recent Mortgage that was taken out on this home.
Original Mortgage
$53,280
Interest Rate
6.11%
Mortgage Type
Purchase Money Mortgage
Purchase Details
Closed on
Nov 14, 2007
Sold by
Sadiq Jaffar and Sadiq Riffat
Bought by
Biel Mary
Purchase Details
Closed on
Nov 8, 2006
Sold by
Hud
Bought by
Sadiq Jaffar and Sadiq Riffat
Purchase Details
Closed on
Jun 13, 2005
Sold by
Hernandez
Bought by
Hud
Create a Home Valuation Report for This Property
The Home Valuation Report is an in-depth analysis detailing your home's value as well as a comparison with similar homes in the area
Home Values in the Area
Average Home Value in this Area
Purchase History
| Date | Buyer | Sale Price | Title Company |
|---|---|---|---|
| Gca Investments Llc | -- | None Available | |
| Jca Fund 11 Llc Series 1477 | $1,500 | Attorney | |
| Wimes Riley | $67,000 | Cst | |
| Biel Mary | $69,000 | None Available | |
| Sadiq Jaffar | -- | Stewart Title Of Illinois | |
| Hud | -- | -- |
Source: Public Records
Mortgage History
| Date | Status | Borrower | Loan Amount |
|---|---|---|---|
| Previous Owner | Wimes Riley | $53,280 |
Source: Public Records
Tax History Compared to Growth
Tax History
| Year | Tax Paid | Tax Assessment Tax Assessment Total Assessment is a certain percentage of the fair market value that is determined by local assessors to be the total taxable value of land and additions on the property. | Land | Improvement |
|---|---|---|---|---|
| 2024 | $6,248 | $9,500 | $1,904 | $7,596 |
| 2023 | $5,335 | $9,500 | $1,904 | $7,596 |
| 2022 | $5,335 | $6,257 | $1,680 | $4,577 |
| 2021 | $5,234 | $6,256 | $1,680 | $4,576 |
| 2020 | $4,421 | $6,256 | $1,680 | $4,576 |
| 2019 | $3,197 | $4,300 | $1,568 | $2,732 |
| 2018 | $3,217 | $4,300 | $1,568 | $2,732 |
| 2017 | $3,055 | $4,300 | $1,568 | $2,732 |
| 2016 | $3,934 | $5,837 | $1,456 | $4,381 |
| 2015 | $3,875 | $5,837 | $1,456 | $4,381 |
| 2014 | $3,727 | $5,837 | $1,456 | $4,381 |
| 2013 | $3,694 | $6,253 | $1,456 | $4,797 |
Source: Public Records
Map
Nearby Homes
- 1481 Lincoln Ave
- 1490 Lincoln Ave
- 1481 Lincoln Place
- 1522 Forest Ave
- 1473 Wentworth Ave
- 1461 Wentworth Ave
- 1531 Lincoln Ave
- 1512 Lincoln Place
- 1527 Wentworth Ave
- 1420 Wentworth Ave
- 1520 Lincoln Place
- 1517 Freeland Ave
- 1464 Shirley Dr
- 1404 Wentworth Ave Unit 1
- 1494 Stanley Blvd
- 1562 Kenilworth Dr
- 1375 Forest Place
- 1567 Kenilworth Dr
- 16 164th Place
- 395 166th St
- 1475 Forest Ave
- 1481 Forest Ave
- 1483 Forest Ave
- 1476 Wentworth Ave
- 1478 Wentworth Ave
- 1478 Wentworth Ave
- 1472 Wentworth Ave
- 1482 Wentworth Ave
- 1491 Forest Ave
- 1468 Wentworth Ave
- 1486 Wentworth Ave
- 1476 Forest Ave
- 1480 Forest Ave
- 1464 Wentworth Ave
- 1482 Forest Ave
- 1470 Forest Ave
- 1488 Wentworth Ave
- 1457 Forest Ave
- 1468 Forest Ave
- 1468 Forest Ave