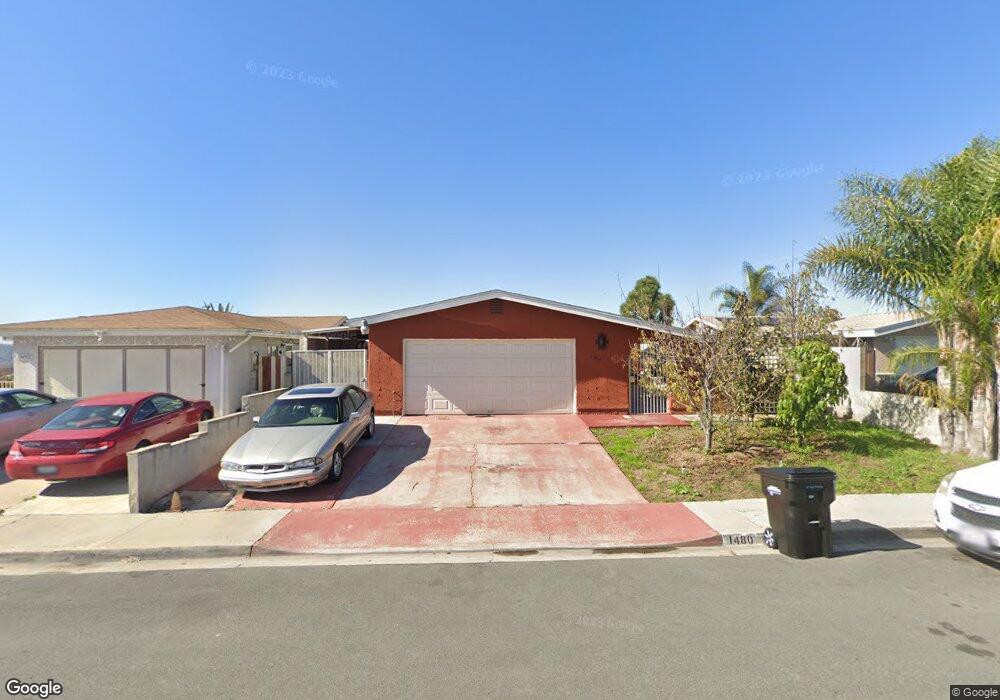
1480 Kenalan Dr San Diego, CA 92154
Otay Mesa West NeighborhoodEstimated Value: $681,525 - $752,000
3
Beds
2
Baths
1,140
Sq Ft
$636/Sq Ft
Est. Value
About This Home
This home is located at 1480 Kenalan Dr, San Diego, CA 92154 and is currently estimated at $724,631, approximately $635 per square foot. 1480 Kenalan Dr is a home located in San Diego County with nearby schools including Los Altos Elementary School, Montgomery Middle School, and Montgomery Senior High School.
Ownership History
Date
Name
Owned For
Owner Type
Purchase Details
Closed on
Oct 20, 2020
Sold by
Trujillo Raymundo and Trujillo Raquel S
Bought by
Trujillo Raymundo and Trujillo Raquel S
Current Estimated Value
Purchase Details
Closed on
Nov 11, 2005
Sold by
Trujillo Raymundo and Trujillo Maria Raquel S
Bought by
Trujillo Raymundo and Trujillo Raquel S
Home Financials for this Owner
Home Financials are based on the most recent Mortgage that was taken out on this home.
Original Mortgage
$260,000
Interest Rate
5.93%
Mortgage Type
New Conventional
Purchase Details
Closed on
Aug 21, 2000
Sold by
Mwjt
Bought by
Trujillo Raymundo and Trujillo Maria Raquel S
Home Financials for this Owner
Home Financials are based on the most recent Mortgage that was taken out on this home.
Original Mortgage
$38,703
Interest Rate
8.15%
Purchase Details
Closed on
Jun 1, 1995
Sold by
Aguirre Jose Jesus
Bought by
Aguirre Laura Olivia
Create a Home Valuation Report for This Property
The Home Valuation Report is an in-depth analysis detailing your home's value as well as a comparison with similar homes in the area
Home Values in the Area
Average Home Value in this Area
Purchase History
| Date | Buyer | Sale Price | Title Company |
|---|---|---|---|
| Trujillo Raymundo | -- | Chicago Title Company | |
| Trujillo Ray | -- | Chicago Title Company | |
| Trujillo Raymundo | -- | Southland Title Of San Diego | |
| Trujillo Raymundo | -- | Fidelity National Title | |
| Aguirre Laura Olivia | -- | -- | |
| Trujillo Raymundo Osuna | -- | -- |
Source: Public Records
Mortgage History
| Date | Status | Borrower | Loan Amount |
|---|---|---|---|
| Closed | Trujillo Raymundo | $260,000 | |
| Closed | Trujillo Raymundo | $38,703 |
Source: Public Records
Tax History Compared to Growth
Tax History
| Year | Tax Paid | Tax Assessment Tax Assessment Total Assessment is a certain percentage of the fair market value that is determined by local assessors to be the total taxable value of land and additions on the property. | Land | Improvement |
|---|---|---|---|---|
| 2025 | $979 | $89,118 | $25,156 | $63,962 |
| 2024 | $979 | $87,371 | $24,663 | $62,708 |
| 2023 | $963 | $85,659 | $24,180 | $61,479 |
| 2022 | $934 | $83,980 | $23,706 | $60,274 |
| 2021 | $911 | $82,335 | $23,242 | $59,093 |
| 2020 | $889 | $81,492 | $23,004 | $58,488 |
| 2019 | $866 | $79,895 | $22,553 | $57,342 |
| 2018 | $851 | $78,329 | $22,111 | $56,218 |
| 2017 | $83 | $76,794 | $21,678 | $55,116 |
| 2016 | $809 | $75,289 | $21,253 | $54,036 |
| 2015 | $797 | $74,159 | $20,934 | $53,225 |
| 2014 | $783 | $72,707 | $20,524 | $52,183 |
Source: Public Records
Map
Nearby Homes
- 4151 Alcorn St
- 3844 Via Del Bardo
- 3903 Via Del Bardo
- 3754 Shooting Star Dr
- 1564 Smythe Ave
- 1819 Smythe Ave Unit 73
- 3679 Rosa Linda St
- 150 Diza Rd
- 3971 Caseman Ave
- 1185 Ransom St
- 1697 Shooting Star Ct
- 4325 Darwin Way
- 3498 Agosto St
- 127 Avenida de la Madrid
- 3414 Del Sol Blvd Unit A
- 3474 Del Sol Blvd Unit C
- 3590 Arey Dr Unit 8
- 1756 Via Del Tanido
- 1378 Starry Way
- 3340 Del Sol Blvd Unit 227
- 1468 Kenalan Dr
- 1492 Kenalan Dr
- 1456 Kenalan Dr
- 1444 Kenalan Dr
- 1481 Kenalan Dr
- 1469 Kenalan Dr
- 1493 Kenalan Dr
- 1506 Kenalan Dr
- 1457 Kenalan Dr
- 1432 Kenalan Dr
- 1503 Kenalan Dr
- 1445 Kenalan Dr
- 1509 Kenalan Dr
- 1512 Kenalan Dr Unit 8
- 1433 Kenalan Dr
- 1420 Kenalan Dr
- 1515 Kenalan Dr
- 1518 Kenalan Dr
- 1421 Kenalan Dr
- 4012 Marzo St