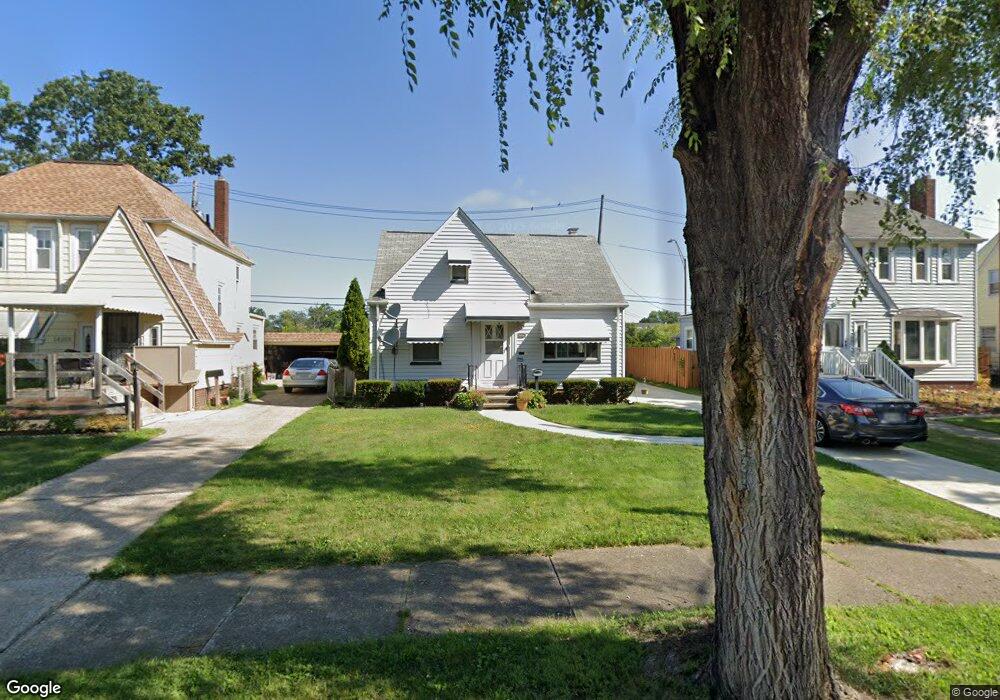
14804 Fernway Ave Cleveland, OH 44111
Kamm's Corners NeighborhoodEstimated Value: $183,000 - $244,000
3
Beds
1
Bath
985
Sq Ft
$214/Sq Ft
Est. Value
About This Home
This home is located at 14804 Fernway Ave, Cleveland, OH 44111 and is currently estimated at $210,848, approximately $214 per square foot. 14804 Fernway Ave is a home located in Cuyahoga County with nearby schools including Artemus Ward School, Almira Academy, and Anton Grdina School.
Ownership History
Date
Name
Owned For
Owner Type
Purchase Details
Closed on
Mar 30, 2006
Sold by
Smith Peter P
Bought by
Tannous Georges E and Chahda Latifeh M
Current Estimated Value
Home Financials for this Owner
Home Financials are based on the most recent Mortgage that was taken out on this home.
Original Mortgage
$87,000
Outstanding Balance
$50,054
Interest Rate
6.38%
Mortgage Type
Fannie Mae Freddie Mac
Estimated Equity
$160,794
Purchase Details
Closed on
May 15, 2000
Sold by
Mccormickmary Irrevocable Trust and Doering Deborah
Bought by
Smith Peter P
Home Financials for this Owner
Home Financials are based on the most recent Mortgage that was taken out on this home.
Original Mortgage
$95,603
Interest Rate
8.21%
Mortgage Type
FHA
Purchase Details
Closed on
Jul 30, 1991
Sold by
Mccormick Joseph
Bought by
Doering, Deborah ( Trustee
Purchase Details
Closed on
Jan 5, 1982
Sold by
Mccormick Joseph and Mccormick Mary
Bought by
Mccormick Joseph
Purchase Details
Closed on
Jan 1, 1975
Bought by
Mccormick Joseph and Mccormick Mary
Create a Home Valuation Report for This Property
The Home Valuation Report is an in-depth analysis detailing your home's value as well as a comparison with similar homes in the area
Home Values in the Area
Average Home Value in this Area
Purchase History
| Date | Buyer | Sale Price | Title Company |
|---|---|---|---|
| Tannous Georges E | $127,000 | City Title Agency | |
| Smith Peter P | $100,000 | Midland Title Security Inc | |
| Doering, Deborah ( Trustee | -- | -- | |
| Mccormick Joseph | -- | -- | |
| Mccormick Joseph | -- | -- |
Source: Public Records
Mortgage History
| Date | Status | Borrower | Loan Amount |
|---|---|---|---|
| Open | Tannous Georges E | $87,000 | |
| Closed | Smith Peter P | $95,603 |
Source: Public Records
Tax History Compared to Growth
Tax History
| Year | Tax Paid | Tax Assessment Tax Assessment Total Assessment is a certain percentage of the fair market value that is determined by local assessors to be the total taxable value of land and additions on the property. | Land | Improvement |
|---|---|---|---|---|
| 2024 | $2,749 | $51,730 | $10,990 | $40,740 |
| 2023 | $2,440 | $41,340 | $8,890 | $32,450 |
| 2022 | $2,458 | $118,100 | $25,400 | $92,700 |
| 2021 | $2,433 | $41,340 | $8,890 | $32,450 |
| 2020 | $1,990 | $31,780 | $6,830 | $24,960 |
| 2019 | $1,840 | $90,800 | $19,500 | $71,300 |
| 2018 | $2,347 | $31,780 | $6,830 | $24,960 |
| 2017 | $2,162 | $34,970 | $6,020 | $28,950 |
| 2016 | $2,145 | $34,970 | $6,020 | $28,950 |
| 2015 | $2,610 | $34,970 | $6,020 | $28,950 |
| 2014 | $2,610 | $31,780 | $5,460 | $26,320 |
Source: Public Records
Map
Nearby Homes
- 2263 Warren Rd
- 2230 Alger Rd
- 2209 Alger Rd
- 14924 Delaware Ave
- 14428 Delaware Ave
- 14426 Alger Rd
- 14926 Esther Ave
- 14909 Arden Ave
- 14924 Arden Ave
- 14404 Bayes Ave
- 15615 Fernway Ave
- 2165 Arthur Ave
- 14104 Hazelmere Ave
- 32743 Warren Rd Unit 19
- 32742 Warren Rd Unit 18
- 14328 Adrian Ave
- 14031 Lakewood Heights Blvd
- 2078 Baxterly Ave
- 2233 Bunts Rd
- 2203 Bunts Rd
- 14800 Fernway Ave
- 14812 Fernway Ave
- 14748 Fernway Ave
- 14816 Fernway Ave
- 14740 Fernway Ave
- 14811 Fernway Ave
- 14736 Fernway Ave
- 14805 Fernway Ave
- 14813 Fernway Ave
- 14801 Fernway Ave
- 14749 Fernway Ave
- 14743 Fernway Ave
- 14817 Fernway Ave
- 14856 Alger Rd
- 14852 Alger Rd
- 14737 Fernway Ave
- 14732 Fernway Ave
- 14844 Alger Rd
- 14840 Alger Rd
- 14733 Fernway Ave