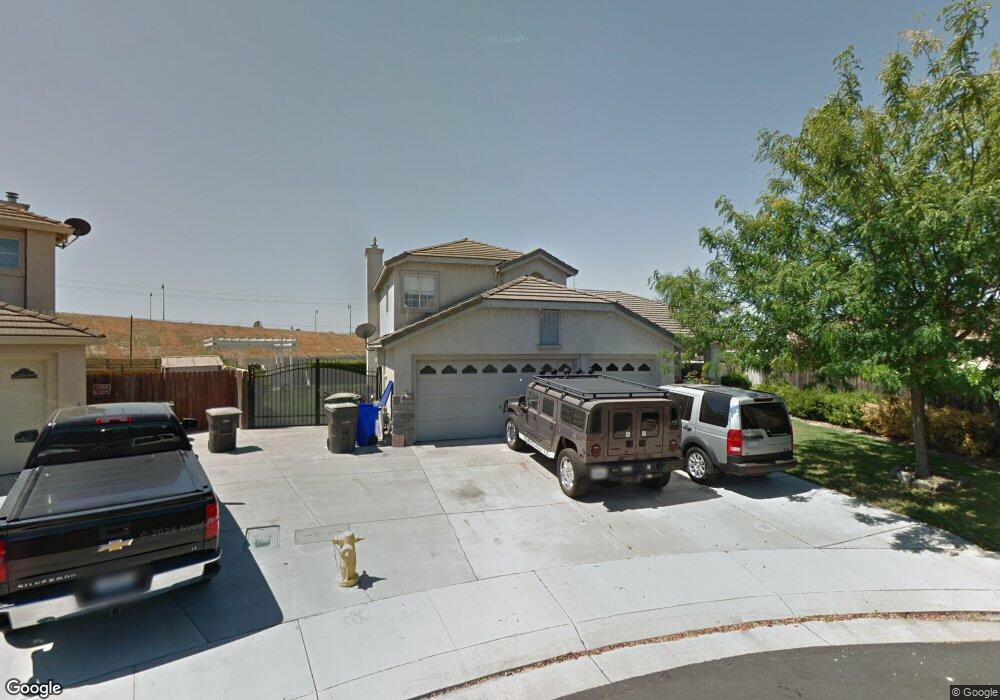
14823 Harbor Ct Lathrop, CA 95330
East Lathrop NeighborhoodEstimated Value: $531,000 - $640,000
4
Beds
3
Baths
2,115
Sq Ft
$280/Sq Ft
Est. Value
About This Home
This home is located at 14823 Harbor Ct, Lathrop, CA 95330 and is currently estimated at $591,733, approximately $279 per square foot. 14823 Harbor Ct is a home located in San Joaquin County with nearby schools including Joseph Widmer, Jr. Elementary School, Lathrop High School, and BE.TECH Charter High School.
Ownership History
Date
Name
Owned For
Owner Type
Purchase Details
Closed on
Jun 3, 2005
Sold by
Aune Eric M and Aune Shieta
Bought by
Singh Ravinder and Kaur Prabjot
Current Estimated Value
Home Financials for this Owner
Home Financials are based on the most recent Mortgage that was taken out on this home.
Original Mortgage
$400,000
Outstanding Balance
$208,286
Interest Rate
5.72%
Mortgage Type
Fannie Mae Freddie Mac
Estimated Equity
$383,447
Purchase Details
Closed on
Dec 12, 1996
Sold by
Mc Bail Company
Bought by
Saini Surinder Singh
Home Financials for this Owner
Home Financials are based on the most recent Mortgage that was taken out on this home.
Original Mortgage
$145,724
Interest Rate
7.76%
Purchase Details
Closed on
Dec 11, 1996
Sold by
Kaur Gurmit
Bought by
Saini Surinder Singh
Home Financials for this Owner
Home Financials are based on the most recent Mortgage that was taken out on this home.
Original Mortgage
$145,724
Interest Rate
7.76%
Create a Home Valuation Report for This Property
The Home Valuation Report is an in-depth analysis detailing your home's value as well as a comparison with similar homes in the area
Home Values in the Area
Average Home Value in this Area
Purchase History
| Date | Buyer | Sale Price | Title Company |
|---|---|---|---|
| Singh Ravinder | $500,000 | Old Republic Title Co | |
| Saini Surinder Singh | $182,500 | Old Republic Title Company | |
| Saini Surinder Singh | -- | Old Republic Title Company |
Source: Public Records
Mortgage History
| Date | Status | Borrower | Loan Amount |
|---|---|---|---|
| Open | Singh Ravinder | $400,000 | |
| Previous Owner | Saini Surinder Singh | $145,724 |
Source: Public Records
Tax History Compared to Growth
Tax History
| Year | Tax Paid | Tax Assessment Tax Assessment Total Assessment is a certain percentage of the fair market value that is determined by local assessors to be the total taxable value of land and additions on the property. | Land | Improvement |
|---|---|---|---|---|
| 2025 | $3,839 | $296,560 | $65,140 | $231,420 |
| 2024 | $3,777 | $290,746 | $63,863 | $226,883 |
| 2023 | $3,680 | $285,046 | $62,611 | $222,435 |
| 2022 | $3,630 | $279,458 | $61,384 | $218,074 |
| 2021 | $3,593 | $273,980 | $60,181 | $213,799 |
| 2020 | $3,466 | $271,171 | $59,564 | $211,607 |
| 2019 | $3,426 | $265,855 | $58,397 | $207,458 |
| 2018 | $3,385 | $260,643 | $57,252 | $203,391 |
| 2017 | $3,341 | $255,533 | $56,130 | $199,403 |
| 2016 | $3,271 | $250,524 | $55,030 | $195,494 |
| 2014 | $3,071 | $241,929 | $53,142 | $188,787 |
Source: Public Records
Map
Nearby Homes
- 813 Sugar Pine Dr
- 14539 Cedar Valley Dr
- 15150 Hollyhock Ct
- 795 Saint Andrew St
- 726 Milestone Dr
- 14129 Reverend Maurice Cotton Dr
- 337 Gardner Place
- 14224 S Harlan Rd
- 15871 7th St
- 13400 Forestwood Way
- 911 Englewood Way
- 1691 Park St
- 13377 Talc St
- 1715 Park St
- 127 Argillite Ave
- 601 Olivine Ave
- 15820 S Harlan Rd Unit 85
- 15820 S Harlan Rd Unit 51
- 15820 S Harlan Rd Unit 111
- 15820 S Harlan Rd Unit 158
- 900 Long Barn Dr
- 912 Long Barn Dr
- 14825 Harbor Ct
- 14836 Harbor Ct
- 924 Long Barn Dr
- 14824 Harbor Ct
- 903 Long Barn Dr
- 891 Long Barn Dr
- 879 Long Barn Dr
- 915 Long Barn Dr
- 936 Long Barn Dr
- 867 Long Barn Dr
- 927 Long Barn Dr
- 948 Long Barn Dr
- 892 Agusta Dr
- 14680 Silver Creek Dr
- 880 Agusta Dr
- 855 Long Barn Dr
- 939 Long Barn Dr
- 14668 Silver Creek Dr