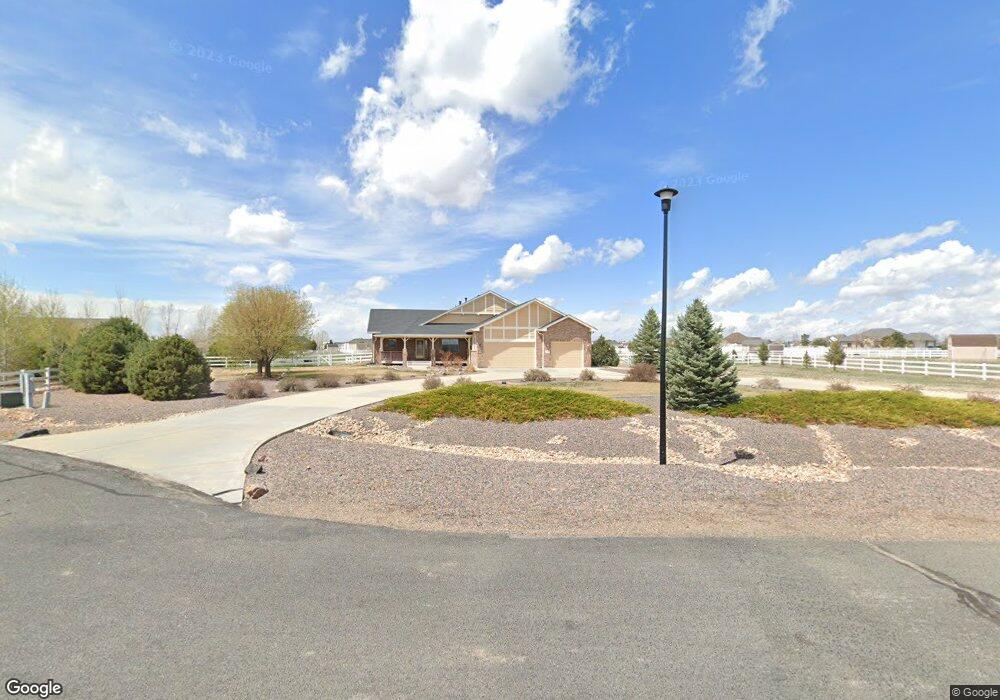
14881 North Ridge St Brighton, CO 80603
Estimated Value: $988,000 - $1,161,000
4
Beds
3
Baths
2,300
Sq Ft
$453/Sq Ft
Est. Value
About This Home
This home is located at 14881 North Ridge St, Brighton, CO 80603 and is currently estimated at $1,041,508, approximately $452 per square foot. 14881 North Ridge St is a home located in Adams County with nearby schools including Pennock Elementary School, Overland Trail Middle School, and Brighton High School.
Ownership History
Date
Name
Owned For
Owner Type
Purchase Details
Closed on
Nov 16, 2020
Sold by
Woolverton David and Woolverton Katherine E
Bought by
Quinn Richard H and Quinn Joyce A
Current Estimated Value
Home Financials for this Owner
Home Financials are based on the most recent Mortgage that was taken out on this home.
Original Mortgage
$411,000
Outstanding Balance
$365,732
Interest Rate
2.8%
Mortgage Type
New Conventional
Estimated Equity
$675,776
Purchase Details
Closed on
Oct 28, 2016
Sold by
Nicks Kerri M and Nicks Kevin P
Bought by
Woolverton David and Woolverton Kathlene E
Home Financials for this Owner
Home Financials are based on the most recent Mortgage that was taken out on this home.
Original Mortgage
$417,000
Interest Rate
3.5%
Mortgage Type
New Conventional
Purchase Details
Closed on
May 10, 2004
Sold by
Box Elder Estates Homesite Sub Llc
Bought by
Nicks Kerri M and Nicks Kevin P
Create a Home Valuation Report for This Property
The Home Valuation Report is an in-depth analysis detailing your home's value as well as a comparison with similar homes in the area
Home Values in the Area
Average Home Value in this Area
Purchase History
| Date | Buyer | Sale Price | Title Company |
|---|---|---|---|
| Quinn Richard H | $853,000 | Chicago Title Co | |
| Woolverton David | $525,000 | First American Title | |
| Nicks Kerri M | $79,950 | -- |
Source: Public Records
Mortgage History
| Date | Status | Borrower | Loan Amount |
|---|---|---|---|
| Open | Quinn Richard H | $411,000 | |
| Previous Owner | Woolverton David | $417,000 |
Source: Public Records
Tax History Compared to Growth
Tax History
| Year | Tax Paid | Tax Assessment Tax Assessment Total Assessment is a certain percentage of the fair market value that is determined by local assessors to be the total taxable value of land and additions on the property. | Land | Improvement |
|---|---|---|---|---|
| 2024 | $6,109 | $57,060 | $12,500 | $44,560 |
| 2023 | $6,078 | $62,440 | $10,150 | $52,290 |
| 2022 | $4,606 | $47,920 | $10,430 | $37,490 |
| 2021 | $4,606 | $47,920 | $10,430 | $37,490 |
| 2020 | $4,056 | $44,040 | $11,150 | $32,890 |
| 2019 | $4,060 | $44,040 | $11,150 | $32,890 |
| 2018 | $3,684 | $39,940 | $5,900 | $34,040 |
| 2017 | $3,679 | $39,940 | $5,900 | $34,040 |
| 2016 | $3,216 | $34,790 | $6,530 | $28,260 |
| 2015 | $3,209 | $39,400 | $6,530 | $32,870 |
| 2014 | -- | $33,680 | $5,970 | $27,710 |
Source: Public Records
Map
Nearby Homes
- 30522 E 148th Ct
- 14955 Lanewood St
- 31200 E 145th Ave
- 6816 E 149th Ave
- 14651 Hayesmount Rd
- 15415 Gadsden Dr
- 32650 E 143rd Ave
- 30460 E 161st Ave
- 30350 E 161st Ave Unit 25
- 30355 E 161st Ave
- 30315 E 161st Ave
- 30045 E 161st Ave
- 16180 Kenosha St
- 31501 E 161st Ct
- 29900 E 162nd Ave
- 31460 E 162nd Ave
- 30300 E 162nd Ave
- 16250 Kenosha St
- 16590 Watkins Rd
- 29780 E 162nd Ave
- 14881 N Ridge St
- 14851 North Ridge St
- 14851 North Ridge St
- 14831 N Ridge St
- 14831 North Ridge St
- 14971 N Ridge St
- 30850 E 150th Ave
- 14842 North Ridge St
- 14842 N Ridge St
- 14912 N Ridge St
- 14912 North Ridge St
- 30700 E 150th Ave
- 30551 E 148th Ct
- 14972 N Ridge St
- 14972 North Ridge St
- 14788 N Maywood Ct
- 30909 E 150th Ave
- 30600 E 150th Ave
- 30829 E 150th Ave
- 30512 E 148th Ct