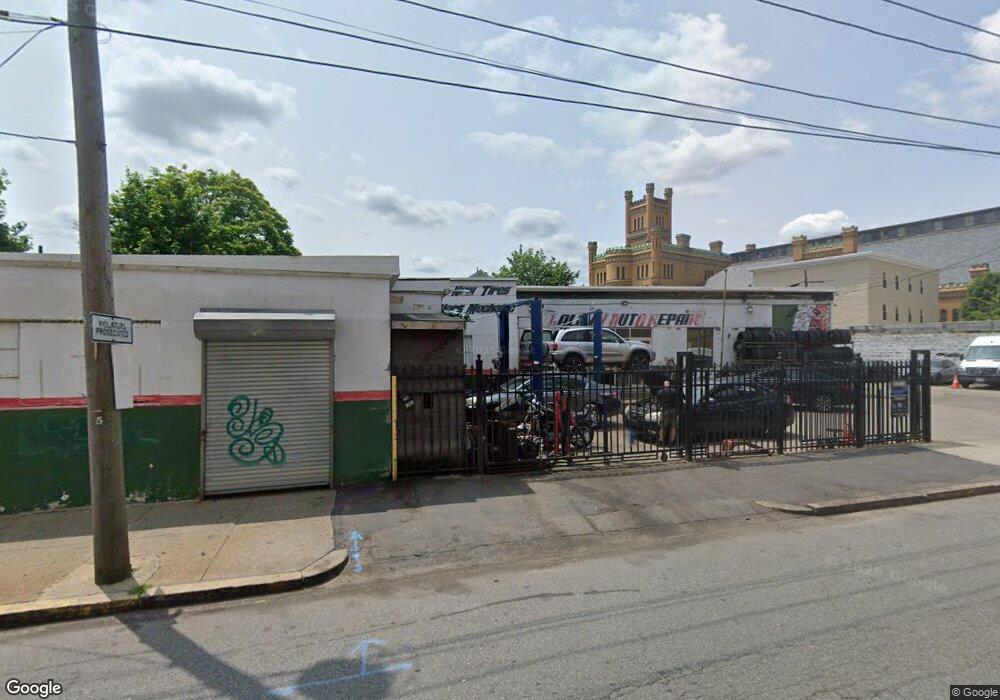
149 Dexter St Providence, RI 02907
West End NeighborhoodEstimated Value: $579,438
--
Bed
--
Bath
3,376
Sq Ft
$172/Sq Ft
Est. Value
About This Home
This home is located at 149 Dexter St, Providence, RI 02907 and is currently estimated at $579,438, approximately $171 per square foot. 149 Dexter St is a home located in Providence County with nearby schools including Asa Messer Elementary School, Charles N. Fortes Elementary School, and Alfred Lima Sr. Elementary School.
Ownership History
Date
Name
Owned For
Owner Type
Purchase Details
Closed on
May 11, 2011
Sold by
Ciaramello Anthony
Bought by
Galaviz Daniel and Hernandez Fernando
Current Estimated Value
Home Financials for this Owner
Home Financials are based on the most recent Mortgage that was taken out on this home.
Original Mortgage
$140,000
Outstanding Balance
$96,948
Interest Rate
4.88%
Mortgage Type
Commercial
Estimated Equity
$482,490
Purchase Details
Closed on
Jul 22, 2009
Sold by
Ciaramello John and Ciaramello Beatrice
Bought by
Ciaramello Anthony
Purchase Details
Closed on
Aug 16, 2000
Sold by
Sedona Assoc
Bought by
Scofield Scott and Scofield Ann Marie
Home Financials for this Owner
Home Financials are based on the most recent Mortgage that was taken out on this home.
Original Mortgage
$30,000
Interest Rate
8.13%
Mortgage Type
Commercial
Create a Home Valuation Report for This Property
The Home Valuation Report is an in-depth analysis detailing your home's value as well as a comparison with similar homes in the area
Home Values in the Area
Average Home Value in this Area
Purchase History
| Date | Buyer | Sale Price | Title Company |
|---|---|---|---|
| Galaviz Daniel | $220,000 | -- | |
| Galaviz Daniel | $220,000 | -- | |
| Ciaramello Anthony | $60,000 | -- | |
| Ciaramello Anthony | $60,000 | -- | |
| Scofield Scott | $30,000 | -- | |
| Scofield Scott | $30,000 | -- |
Source: Public Records
Mortgage History
| Date | Status | Borrower | Loan Amount |
|---|---|---|---|
| Open | Scofield Scott | $140,000 | |
| Closed | Scofield Scott | $140,000 | |
| Previous Owner | Scofield Scott | $30,000 |
Source: Public Records
Tax History Compared to Growth
Tax History
| Year | Tax Paid | Tax Assessment Tax Assessment Total Assessment is a certain percentage of the fair market value that is determined by local assessors to be the total taxable value of land and additions on the property. | Land | Improvement |
|---|---|---|---|---|
| 2025 | $9,648 | $330,400 | $163,600 | $166,800 |
| 2024 | $7,547 | $215,000 | $83,900 | $131,100 |
| 2023 | $7,547 | $215,000 | $83,900 | $131,100 |
| 2022 | $7,611 | $215,000 | $83,900 | $131,100 |
| 2021 | $5,868 | $159,900 | $76,500 | $83,400 |
| 2020 | $5,868 | $159,900 | $76,500 | $83,400 |
| 2019 | $5,868 | $159,900 | $76,500 | $83,400 |
| 2018 | $5,821 | $158,600 | $76,500 | $82,100 |
| 2017 | $5,821 | $158,600 | $76,500 | $82,100 |
| 2016 | $5,821 | $158,600 | $76,500 | $82,100 |
| 2015 | $5,560 | $151,300 | $72,800 | $78,500 |
| 2014 | $5,560 | $151,300 | $72,800 | $78,500 |
| 2013 | $5,560 | $151,300 | $72,800 | $78,500 |
Source: Public Records
Map
Nearby Homes