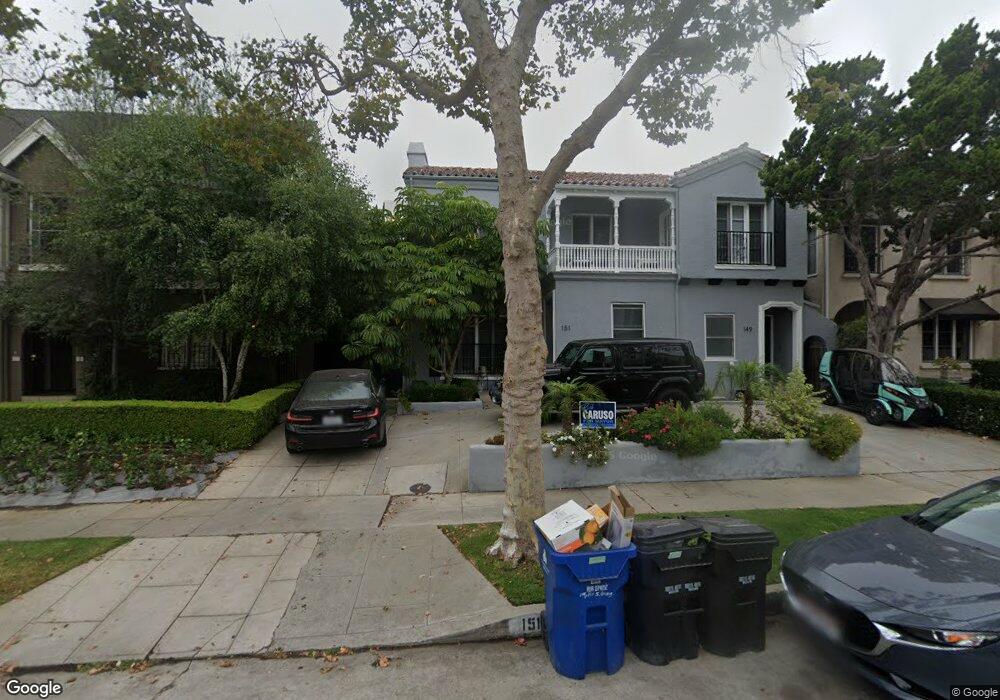
149 S Orange Dr Los Angeles, CA 90036
Hancock Park NeighborhoodEstimated Value: $2,265,000 - $3,836,689
8
Beds
8
Baths
5,780
Sq Ft
$493/Sq Ft
Est. Value
About This Home
This home is located at 149 S Orange Dr, Los Angeles, CA 90036 and is currently estimated at $2,849,172, approximately $492 per square foot. 149 S Orange Dr is a home located in Los Angeles County with nearby schools including Third Street Elementary School, John Burroughs Middle School, and Fairfax High School.
Ownership History
Date
Name
Owned For
Owner Type
Purchase Details
Closed on
Feb 11, 2005
Sold by
Silverman Norman and Silverman Hedy
Bought by
Eraj Enterprises Llc
Current Estimated Value
Purchase Details
Closed on
Sep 8, 2004
Sold by
Wong Md Michael James and Fay Marion C
Bought by
Silverman Norman
Home Financials for this Owner
Home Financials are based on the most recent Mortgage that was taken out on this home.
Original Mortgage
$800,000
Interest Rate
5.69%
Mortgage Type
Purchase Money Mortgage
Purchase Details
Closed on
Feb 20, 2002
Sold by
Wong Md Michael James
Bought by
Wong Md Michael James
Home Financials for this Owner
Home Financials are based on the most recent Mortgage that was taken out on this home.
Original Mortgage
$400,000
Interest Rate
6.8%
Purchase Details
Closed on
May 1, 1996
Sold by
Fay Marion C
Bought by
Wong Md Michael James
Purchase Details
Closed on
Mar 28, 1996
Sold by
Fay Marion C
Bought by
Wong Md Michael James
Create a Home Valuation Report for This Property
The Home Valuation Report is an in-depth analysis detailing your home's value as well as a comparison with similar homes in the area
Home Values in the Area
Average Home Value in this Area
Purchase History
| Date | Buyer | Sale Price | Title Company |
|---|---|---|---|
| Eraj Enterprises Llc | -- | -- | |
| Silverman Norman | $1,568,000 | Equity Title Company | |
| Wong Md Michael James | -- | Fidelity National Title | |
| Wong Md Michael James | -- | -- | |
| Wong Md Michael James | -- | -- |
Source: Public Records
Mortgage History
| Date | Status | Borrower | Loan Amount |
|---|---|---|---|
| Previous Owner | Silverman Norman | $800,000 | |
| Previous Owner | Wong Md Michael James | $400,000 |
Source: Public Records
Tax History Compared to Growth
Tax History
| Year | Tax Paid | Tax Assessment Tax Assessment Total Assessment is a certain percentage of the fair market value that is determined by local assessors to be the total taxable value of land and additions on the property. | Land | Improvement |
|---|---|---|---|---|
| 2025 | $26,889 | $2,227,861 | $1,254,519 | $973,342 |
| 2024 | $26,889 | $2,184,178 | $1,229,921 | $954,257 |
| 2023 | $26,373 | $2,141,352 | $1,205,805 | $935,547 |
| 2022 | $25,152 | $2,099,365 | $1,182,162 | $917,203 |
| 2021 | $24,825 | $2,058,202 | $1,158,983 | $899,219 |
| 2019 | $23,639 | $1,959,313 | $1,124,608 | $834,705 |
| 2018 | $23,490 | $1,920,896 | $1,102,557 | $818,339 |
| 2016 | $22,434 | $1,846,308 | $1,059,745 | $786,563 |
| 2015 | $22,106 | $1,818,576 | $1,043,827 | $774,749 |
| 2014 | $22,175 | $1,782,953 | $1,023,380 | $759,573 |
Source: Public Records
Map
Nearby Homes
- 109 N Sycamore Ave Unit 102
- 120 N Orange Dr
- 143 S Highland Ave
- 183 S Detroit St
- 203 S Detroit St Unit 201
- 143 N Sycamore Ave
- 147 N Detroit St
- 348 S Orange Dr
- 172 S Mccadden Place
- 358 S Sycamore Ave
- 160 S Poinsettia Place
- 157 N Las Palmas Ave
- 452 S Sycamore Ave
- 101 S Fuller Ave
- 601 S La Brea Ave
- 191 S Hudson Ave
- 600 S Orange Dr
- 420 N Orange Dr
- 614 S Orange Dr
- 228 S Hudson Ave
- 143 S Orange Dr Unit STUDIO
- 143 S Orange Dr
- 155 S Orange Dr
- 145 S Orange Dr
- 159 S Orange Dr
- 139 S Orange Dr Unit U
- 139 S Orange Dr
- 161 S Orange Dr
- 144 S Sycamore Ave
- 156 S Sycamore Ave
- 135 S Orange Dr Unit L
- 135 S Orange Dr
- 165 S Orange Dr
- 133 N Orange Dr
- 160 S Sycamore Ave
- 138 S Sycamore Ave
- 150 S Orange Dr
- 144 S Orange Dr
- 162 S Sycamore Ave Unit 162 1/2
- 162 S Sycamore Ave