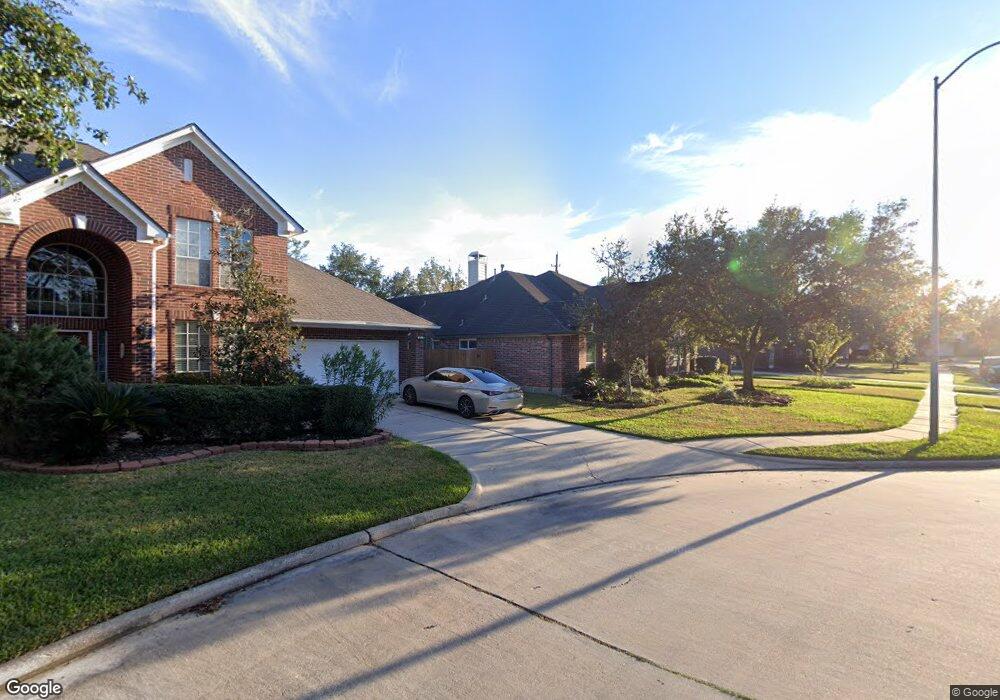
14911 Windmill Cove Ln Cypress, TX 77429
Estimated Value: $411,000 - $428,000
3
Beds
2
Baths
2,449
Sq Ft
$171/Sq Ft
Est. Value
About This Home
This home is located at 14911 Windmill Cove Ln, Cypress, TX 77429 and is currently estimated at $419,138, approximately $171 per square foot. 14911 Windmill Cove Ln is a home located in Harris County with nearby schools including Hamilton Elementary School, Hamilton Middle School, and Cy-Fair High School.
Ownership History
Date
Name
Owned For
Owner Type
Purchase Details
Closed on
Aug 30, 2001
Sold by
Watkins Betty C
Bought by
Winn Thyda R
Current Estimated Value
Home Financials for this Owner
Home Financials are based on the most recent Mortgage that was taken out on this home.
Original Mortgage
$120,000
Outstanding Balance
$47,066
Interest Rate
7.07%
Estimated Equity
$372,072
Purchase Details
Closed on
Oct 11, 1996
Sold by
Weekley Homes Inc
Bought by
Watkins Ronald Howard
Home Financials for this Owner
Home Financials are based on the most recent Mortgage that was taken out on this home.
Original Mortgage
$162,850
Interest Rate
8.33%
Purchase Details
Closed on
Jun 13, 1996
Sold by
Pilgrim Louetta Ltd Partnership
Bought by
Weekley Homes Inc
Home Financials for this Owner
Home Financials are based on the most recent Mortgage that was taken out on this home.
Original Mortgage
$113,400
Interest Rate
8.1%
Mortgage Type
Purchase Money Mortgage
Create a Home Valuation Report for This Property
The Home Valuation Report is an in-depth analysis detailing your home's value as well as a comparison with similar homes in the area
Home Values in the Area
Average Home Value in this Area
Purchase History
| Date | Buyer | Sale Price | Title Company |
|---|---|---|---|
| Winn Thyda R | -- | Stewart Title | |
| Watkins Ronald Howard | -- | Priority Title | |
| Weekley Homes Inc | -- | Priority Title |
Source: Public Records
Mortgage History
| Date | Status | Borrower | Loan Amount |
|---|---|---|---|
| Open | Winn Thyda R | $120,000 | |
| Previous Owner | Watkins Ronald Howard | $162,850 | |
| Previous Owner | Weekley Homes Inc | $113,400 |
Source: Public Records
Tax History Compared to Growth
Tax History
| Year | Tax Paid | Tax Assessment Tax Assessment Total Assessment is a certain percentage of the fair market value that is determined by local assessors to be the total taxable value of land and additions on the property. | Land | Improvement |
|---|---|---|---|---|
| 2025 | $6,343 | $418,991 | $102,780 | $316,211 |
| 2024 | $6,343 | $416,133 | $102,780 | $313,353 |
| 2023 | $6,343 | $398,000 | $102,780 | $295,220 |
| 2022 | $7,751 | $425,635 | $73,545 | $352,090 |
| 2021 | $7,386 | $297,397 | $71,339 | $226,058 |
| 2020 | $7,010 | $276,863 | $48,878 | $227,985 |
| 2019 | $6,598 | $250,000 | $45,457 | $204,543 |
| 2018 | $1,707 | $179,464 | $48,878 | $130,586 |
| 2017 | $7,087 | $281,592 | $48,878 | $232,714 |
| 2016 | $6,443 | $240,000 | $48,878 | $191,122 |
| 2015 | $5,478 | $258,336 | $48,878 | $209,458 |
| 2014 | $5,478 | $258,336 | $48,878 | $209,458 |
Source: Public Records
Map
Nearby Homes
- 14915 Windmill Cove Ln
- 14906 Stonemeade Place
- 14822 Kingsford Willow Ln
- 14807 Providence Manor Way
- 6 Airport Drive Lot # 6
- 13531 Clareton Ln
- 15110 Green Tavern Ct
- 0 Maxwell Rd Unit 67788253
- 14555 Cypress North Houston
- 14210 Northface Manor Ct
- 13926 Wessex Park Dr
- 15102 Cypress Green Dr
- 12214 Francel Ln
- 13506 Contado Ct
- 15922 Clipper Pointe Dr
- 13002 Huffmeister Rd
- 14539 Gleaming Rose Dr
- 14914 Codys Run
- 13443 Missarah Ln
- 14634 Bergenia Dr
- 14907 Windmill Cove Ln
- 14919 Windmill Cove Ln
- 14910 Windmill Cove Ln
- 14906 Windmill Cove Ln
- 14914 Windmill Cove Ln
- 14902 Windmill Cove Ln
- 14918 Windmill Cove Ln
- 14838 Kingsford Willow Ln
- 13507 Winebrook Ct
- 13511 Winebrook Ct
- 13606 Greenwood Gable Ln
- 13515 Winebrook Ct
- 14834 Kingsford Willow Ln
- 13503 Winebrook Ct
- 14927 Windmill Cove Ln
- 13519 Winebrook Ct
- 14931 Windmill Cove Ln
- 13610 Greenwood Gable Ln
- 14935 Windmill Cove Ln
- 14830 Kingsford Willow Ln