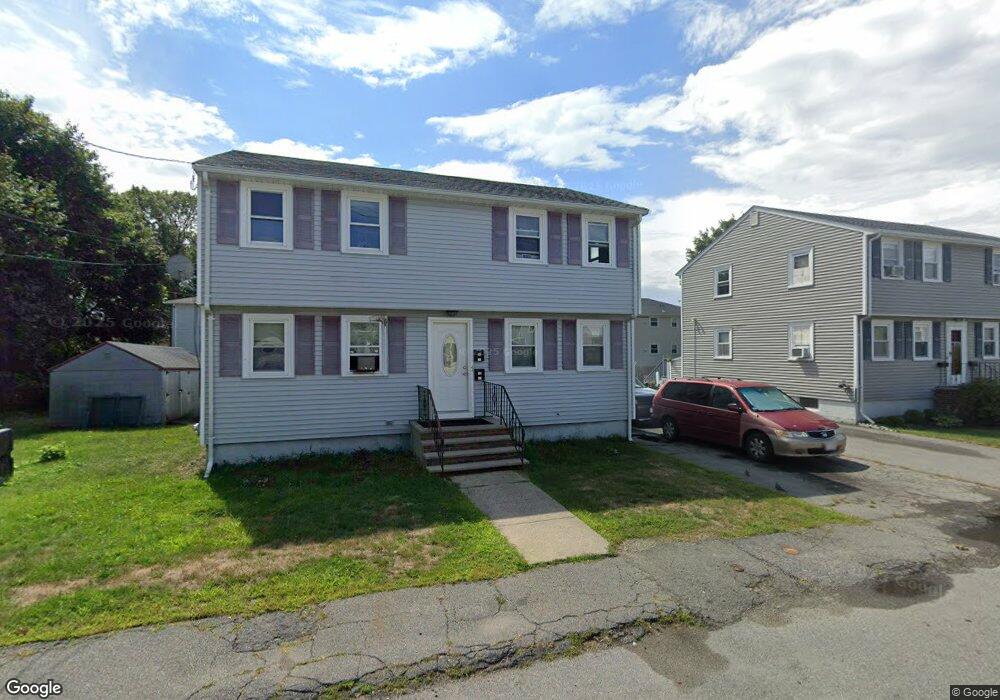
15 Jewett St Quincy, MA 02169
Adams Shore NeighborhoodEstimated Value: $676,000 - $821,000
4
Beds
2
Baths
1,728
Sq Ft
$430/Sq Ft
Est. Value
About This Home
This home is located at 15 Jewett St, Quincy, MA 02169 and is currently estimated at $742,463, approximately $429 per square foot. 15 Jewett St is a home located in Norfolk County with nearby schools including Atherton Hough Elementary School, Broad Meadows Middle School, and Quincy High School.
Ownership History
Date
Name
Owned For
Owner Type
Purchase Details
Closed on
Oct 24, 2023
Sold by
Doan Loan and Thach Bill
Bought by
Doan Loan
Current Estimated Value
Home Financials for this Owner
Home Financials are based on the most recent Mortgage that was taken out on this home.
Original Mortgage
$510,000
Outstanding Balance
$499,156
Interest Rate
7.18%
Mortgage Type
Stand Alone Refi Refinance Of Original Loan
Estimated Equity
$243,307
Purchase Details
Closed on
Jan 25, 2017
Sold by
Bernozzi Joel R and Deutsche Bank Natl T C
Bought by
Deutsche Bk Natl T Co
Purchase Details
Closed on
Aug 16, 2006
Sold by
Gedutis Kevin
Bought by
Bernozzi Joel R
Home Financials for this Owner
Home Financials are based on the most recent Mortgage that was taken out on this home.
Original Mortgage
$336,000
Interest Rate
6.88%
Mortgage Type
Purchase Money Mortgage
Create a Home Valuation Report for This Property
The Home Valuation Report is an in-depth analysis detailing your home's value as well as a comparison with similar homes in the area
Home Values in the Area
Average Home Value in this Area
Purchase History
| Date | Buyer | Sale Price | Title Company |
|---|---|---|---|
| Doan Loan | -- | None Available | |
| Doan Loan | -- | None Available | |
| Deutsche Bk Natl T Co | $368,000 | -- | |
| Deutsche Bk Natl T Co | $368,000 | -- | |
| Bernozzi Joel R | $420,000 | -- | |
| Bernozzi Joel R | $420,000 | -- |
Source: Public Records
Mortgage History
| Date | Status | Borrower | Loan Amount |
|---|---|---|---|
| Open | Doan Loan | $510,000 | |
| Previous Owner | Bernozzi Joel R | $336,000 | |
| Previous Owner | Bernozzi Joel R | $84,000 | |
| Previous Owner | Bernozzi Joel R | $180,000 |
Source: Public Records
Tax History Compared to Growth
Tax History
| Year | Tax Paid | Tax Assessment Tax Assessment Total Assessment is a certain percentage of the fair market value that is determined by local assessors to be the total taxable value of land and additions on the property. | Land | Improvement |
|---|---|---|---|---|
| 2025 | $7,887 | $684,000 | $287,000 | $397,000 |
| 2024 | $7,257 | $643,900 | $261,100 | $382,800 |
| 2023 | $6,763 | $607,600 | $237,500 | $370,100 |
| 2022 | $6,530 | $545,100 | $206,800 | $338,300 |
| 2021 | $6,071 | $500,100 | $206,800 | $293,300 |
| 2020 | $6,217 | $500,200 | $206,800 | $293,400 |
| 2019 | $5,786 | $461,000 | $191,700 | $269,300 |
| 2018 | $5,691 | $426,600 | $167,000 | $259,600 |
| 2017 | $5,368 | $378,800 | $167,000 | $211,800 |
| 2016 | $5,004 | $348,500 | $152,000 | $196,500 |
| 2015 | $5,059 | $346,500 | $140,900 | $205,600 |
| 2014 | $4,553 | $306,400 | $140,900 | $165,500 |
Source: Public Records
Map
Nearby Homes