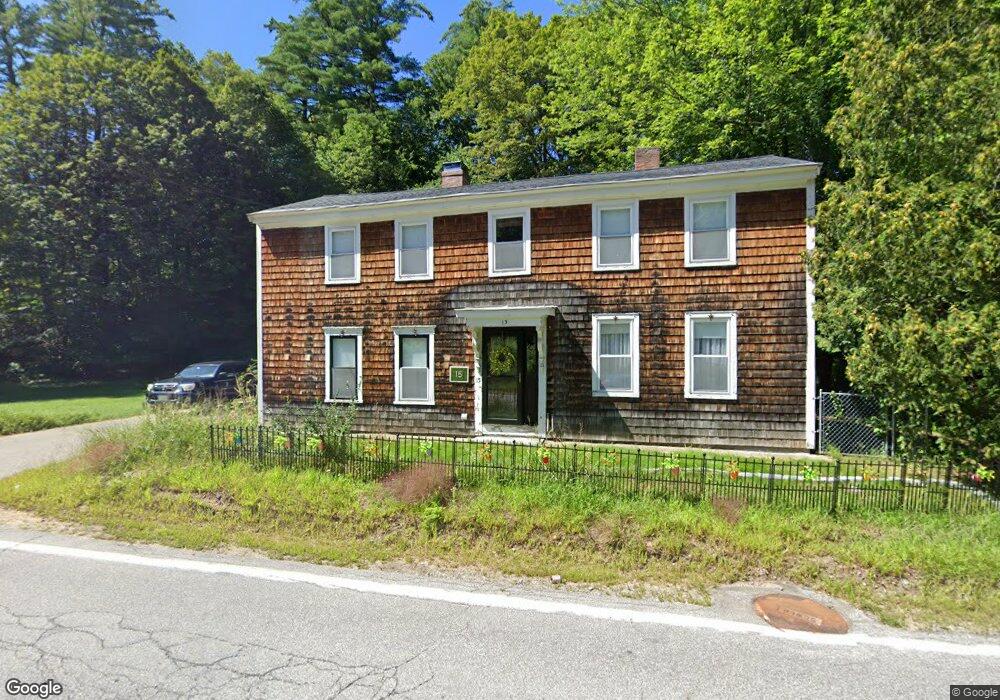
15 Old South Main St Franklin, NH 03235
Estimated Value: $416,030 - $514,000
4
Beds
2
Baths
2,825
Sq Ft
$163/Sq Ft
Est. Value
About This Home
This home is located at 15 Old South Main St, Franklin, NH 03235 and is currently estimated at $459,258, approximately $162 per square foot. 15 Old South Main St is a home located in Merrimack County with nearby schools including Paul A. Smith School, Franklin Middle School, and Franklin High School.
Ownership History
Date
Name
Owned For
Owner Type
Purchase Details
Closed on
Oct 29, 2003
Sold by
Nash Michael J and Nash Gloria
Bought by
Vandernoot Jennifer B
Current Estimated Value
Home Financials for this Owner
Home Financials are based on the most recent Mortgage that was taken out on this home.
Original Mortgage
$147,000
Outstanding Balance
$68,386
Interest Rate
6.05%
Estimated Equity
$390,872
Purchase Details
Closed on
May 13, 1998
Sold by
Humphrey Terrance W and Humphrey Helen M
Bought by
Nash Michael J and Nash Gloria
Home Financials for this Owner
Home Financials are based on the most recent Mortgage that was taken out on this home.
Original Mortgage
$94,000
Interest Rate
7.08%
Create a Home Valuation Report for This Property
The Home Valuation Report is an in-depth analysis detailing your home's value as well as a comparison with similar homes in the area
Home Values in the Area
Average Home Value in this Area
Purchase History
| Date | Buyer | Sale Price | Title Company |
|---|---|---|---|
| Vandernoot Jennifer B | $155,000 | -- | |
| Nash Michael J | $94,000 | -- |
Source: Public Records
Mortgage History
| Date | Status | Borrower | Loan Amount |
|---|---|---|---|
| Open | Nash Michael J | $147,000 | |
| Previous Owner | Nash Michael J | $94,000 |
Source: Public Records
Tax History Compared to Growth
Tax History
| Year | Tax Paid | Tax Assessment Tax Assessment Total Assessment is a certain percentage of the fair market value that is determined by local assessors to be the total taxable value of land and additions on the property. | Land | Improvement |
|---|---|---|---|---|
| 2024 | $5,320 | $310,200 | $87,200 | $223,000 |
| 2023 | $5,044 | $310,200 | $87,200 | $223,000 |
| 2022 | $4,151 | $170,200 | $72,600 | $97,600 |
| 2021 | $3,985 | $171,700 | $72,600 | $99,100 |
| 2020 | $6,240 | $171,700 | $72,600 | $99,100 |
| 2019 | $5,349 | $171,700 | $72,600 | $99,100 |
| 2018 | $3,771 | $171,700 | $72,600 | $99,100 |
| 2017 | $3,816 | $149,300 | $38,200 | $111,100 |
| 2016 | $3,767 | $149,300 | $38,200 | $111,100 |
| 2015 | $2,608 | $104,510 | $26,740 | $77,770 |
| 2011 | $3,732 | $173,400 | $37,200 | $136,200 |
Source: Public Records
Map
Nearby Homes