Estimated Value: $237,218 - $313,000
--
Bed
--
Bath
1,894
Sq Ft
$140/Sq Ft
Est. Value
About This Home
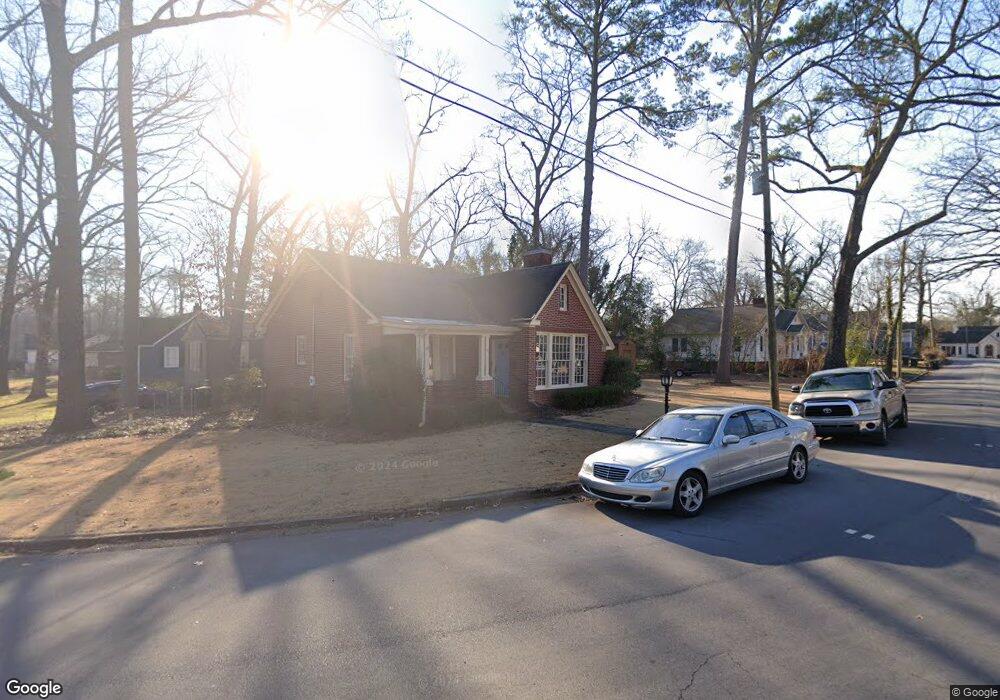
This home is located at 15 Vineland Dr NW, Rome, GA 30165 and is currently estimated at $265,055, approximately $139 per square foot. 15 Vineland Dr NW is a home located in Floyd County with nearby schools including Rome High School.
Ownership History
Date
Name
Owned For
Owner Type
Purchase Details
Closed on
Apr 3, 1987
Sold by
Hinderliter Dan R and Hinderliter Emily S
Bought by
Dent Charles Frederick
Current Estimated Value
Purchase Details
Closed on
Apr 30, 1985
Sold by
Long Richard Lamar and Long Clair I
Bought by
Hinderliter Dan R and Hinderl Emily S
Purchase Details
Closed on
Oct 21, 1983
Sold by
Carter Paul R and Janice Lee
Bought by
Long Richard Lamar and Long Clair I
Purchase Details
Closed on
Feb 25, 1976
Sold by
Hall Brenda R
Bought by
Carter Paul R and Janice Lee
Purchase Details
Closed on
Jun 13, 1973
Sold by
Milam Robert L
Bought by
Hall Brenda R
Purchase Details
Closed on
Mar 11, 1968
Sold by
Brumbelow Glenn C
Bought by
Milam Robert L
Purchase Details
Closed on
Sep 13, 1965
Sold by
Diprima Marcus
Bought by
Brumbelow Glenn C
Purchase Details
Closed on
Jan 1, 1901
Bought by
Diprima Marcus
Create a Home Valuation Report for This Property
The Home Valuation Report is an in-depth analysis detailing your home's value as well as a comparison with similar homes in the area
Home Values in the Area
Average Home Value in this Area
Purchase History
| Date | Buyer | Sale Price | Title Company |
|---|---|---|---|
| Dent Charles Frederick | $60,000 | -- | |
| Hinderliter Dan R | $49,000 | -- | |
| Long Richard Lamar | $41,500 | -- | |
| Carter Paul R | $30,000 | -- | |
| Hall Brenda R | $23,900 | -- | |
| Milam Robert L | $4,000 | -- | |
| Brumbelow Glenn C | $8,500 | -- | |
| Diprima Marcus | -- | -- |
Source: Public Records
Tax History Compared to Growth
Tax History
| Year | Tax Paid | Tax Assessment Tax Assessment Total Assessment is a certain percentage of the fair market value that is determined by local assessors to be the total taxable value of land and additions on the property. | Land | Improvement |
|---|---|---|---|---|
| 2024 | $1,917 | $106,494 | $11,130 | $95,364 |
| 2023 | $1,563 | $86,958 | $10,118 | $76,840 |
| 2022 | $1,352 | $71,310 | $8,348 | $62,962 |
| 2021 | $1,244 | $64,112 | $8,348 | $55,764 |
| 2020 | $1,162 | $58,631 | $6,324 | $52,307 |
| 2019 | $1,032 | $52,084 | $6,324 | $45,760 |
| 2018 | $975 | $48,844 | $6,324 | $42,520 |
| 2017 | $942 | $46,924 | $6,324 | $40,600 |
| 2016 | $1,624 | $45,741 | $6,320 | $39,421 |
| 2015 | $1,536 | $45,741 | $6,320 | $39,421 |
| 2014 | $1,536 | $45,741 | $6,320 | $39,421 |
Source: Public Records
Map
Nearby Homes
- 614 Briarwood Cir NW
- 808 Charlton St NW
- 208 Dodd St NW
- 204 Oakwood St NW
- 7 Raymond Ave NW
- 105 Robin St NW
- 0 Unbridled Rd Unit 22 23074684
- 4 Colonial Dr NW
- 124 Sheridan Dr NW
- 23 Sweetspire Dr NW
- 21 Sweetspire Dr NW
- 15 Silverbell Ln
- 209 Sherwood Rd SW
- 9 Shorter Cir SW
- 8 S Hughes St SW
- 214 N Elm St NW
- 3 Berckman Ln SW
- 19 Berckman Ln SW
- 11 Vineland Dr NW
- 0 Vineland Dr NW Unit 17 8271559
- 0 Vineland Dr NW Unit 17
- 0 Vineland Dr NW Unit 9052357
- 0 Vineland Dr NW Unit 3135130
- 0 Vineland Dr NW Unit 7084627
- 0 Vineland Dr NW Unit 7122370
- 0 Vineland Dr NW Unit 7625773
- 0 Vineland Dr NW Unit 8258604
- 23 Vineland Dr NW
- 28 Vineland Dr NW
- 9 Vineland Dr NW
- 7 Vineland Dr NW
- 14 Vineland Dr NW Unit 10 & 11
- 514 Charlton St NW
- 26 Vineland Dr NW
- 16 Vineland Dr NW
- 512 Charlton St NW
- 10 Vineland Dr NW
- 508 Charlton St NW