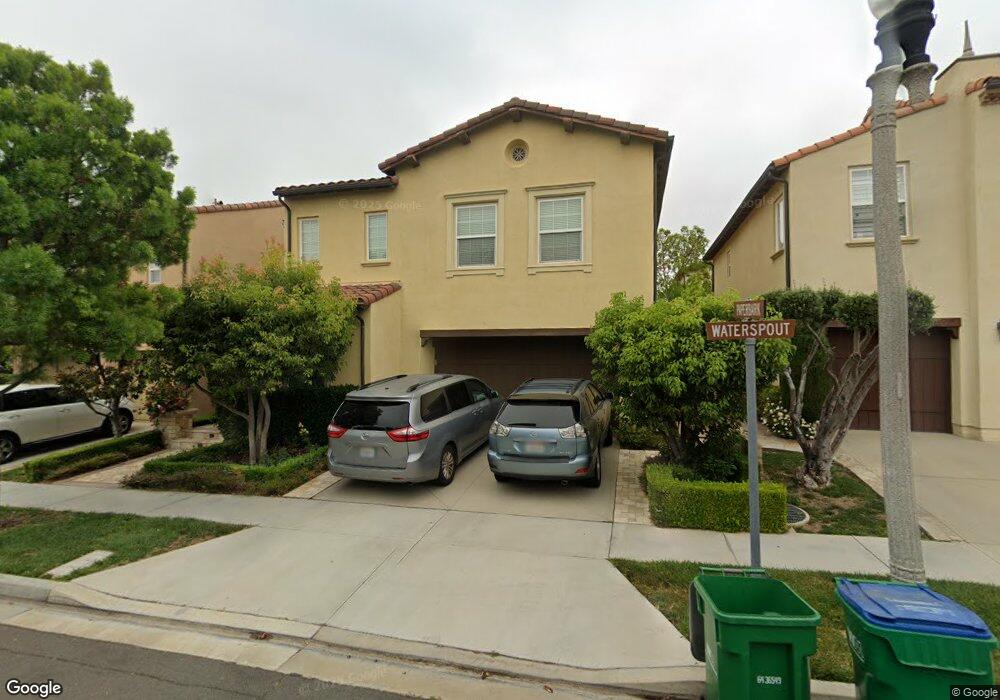
15 Waterspout Irvine, CA 92620
Woodbury and Stonegate NeighborhoodEstimated Value: $1,895,000 - $2,172,000
4
Beds
3
Baths
2,339
Sq Ft
$864/Sq Ft
Est. Value
About This Home
This home is located at 15 Waterspout, Irvine, CA 92620 and is currently estimated at $2,021,941, approximately $864 per square foot. 15 Waterspout is a home located in Orange County with nearby schools including Jeffrey Trail Middle, Portola High School, and New Horizon Elementary School.
Ownership History
Date
Name
Owned For
Owner Type
Purchase Details
Closed on
Apr 14, 2017
Sold by
Kuo Richard Yuan Heng and Lin Julia P
Bought by
Kuo Richard and Lin Julia
Current Estimated Value
Purchase Details
Closed on
Nov 7, 2011
Sold by
Kuo Richard Yuan Heng and Kuo Cynthia Chiung Chu
Bought by
Kuo Richard Yuan Heng and Lin Julia P
Home Financials for this Owner
Home Financials are based on the most recent Mortgage that was taken out on this home.
Original Mortgage
$300,000
Outstanding Balance
$30,472
Interest Rate
4.09%
Mortgage Type
New Conventional
Estimated Equity
$1,991,469
Purchase Details
Closed on
May 26, 2006
Sold by
California Pacific Homes Lp
Bought by
Kuo Richard Yuan Heng and Kuo Cynthia Chiung Chu
Home Financials for this Owner
Home Financials are based on the most recent Mortgage that was taken out on this home.
Original Mortgage
$350,000
Interest Rate
6.12%
Mortgage Type
Purchase Money Mortgage
Purchase Details
Closed on
Nov 21, 2005
Sold by
Kuo Kung Li
Bought by
Kuo Cynthia Chiung Chu
Create a Home Valuation Report for This Property
The Home Valuation Report is an in-depth analysis detailing your home's value as well as a comparison with similar homes in the area
Home Values in the Area
Average Home Value in this Area
Purchase History
| Date | Buyer | Sale Price | Title Company |
|---|---|---|---|
| Kuo Richard | -- | None Available | |
| Kuo Richard Yuan Heng | -- | Advantage Title Inc | |
| Kuo Richard Yuan Heng | $940,000 | Fidelity National Title-Buil | |
| Kuo Cynthia Chiung Chu | -- | Fidelity National Title Co |
Source: Public Records
Mortgage History
| Date | Status | Borrower | Loan Amount |
|---|---|---|---|
| Open | Kuo Richard Yuan Heng | $300,000 | |
| Closed | Kuo Richard Yuan Heng | $350,000 |
Source: Public Records
Tax History Compared to Growth
Tax History
| Year | Tax Paid | Tax Assessment Tax Assessment Total Assessment is a certain percentage of the fair market value that is determined by local assessors to be the total taxable value of land and additions on the property. | Land | Improvement |
|---|---|---|---|---|
| 2025 | $15,308 | $1,153,504 | $681,833 | $471,671 |
| 2024 | $15,308 | $1,130,887 | $668,464 | $462,423 |
| 2023 | $14,998 | $1,108,713 | $655,357 | $453,356 |
| 2022 | $14,737 | $1,086,974 | $642,507 | $444,467 |
| 2021 | $14,489 | $1,065,661 | $629,909 | $435,752 |
| 2020 | $14,304 | $1,054,734 | $623,450 | $431,284 |
| 2019 | $14,695 | $1,034,053 | $611,225 | $422,828 |
| 2018 | $14,458 | $1,013,778 | $599,240 | $414,538 |
| 2017 | $14,254 | $993,900 | $587,490 | $406,410 |
| 2016 | $14,213 | $974,412 | $575,970 | $398,442 |
| 2015 | $14,031 | $959,776 | $567,318 | $392,458 |
| 2014 | $13,837 | $940,976 | $556,205 | $384,771 |
Source: Public Records
Map
Nearby Homes