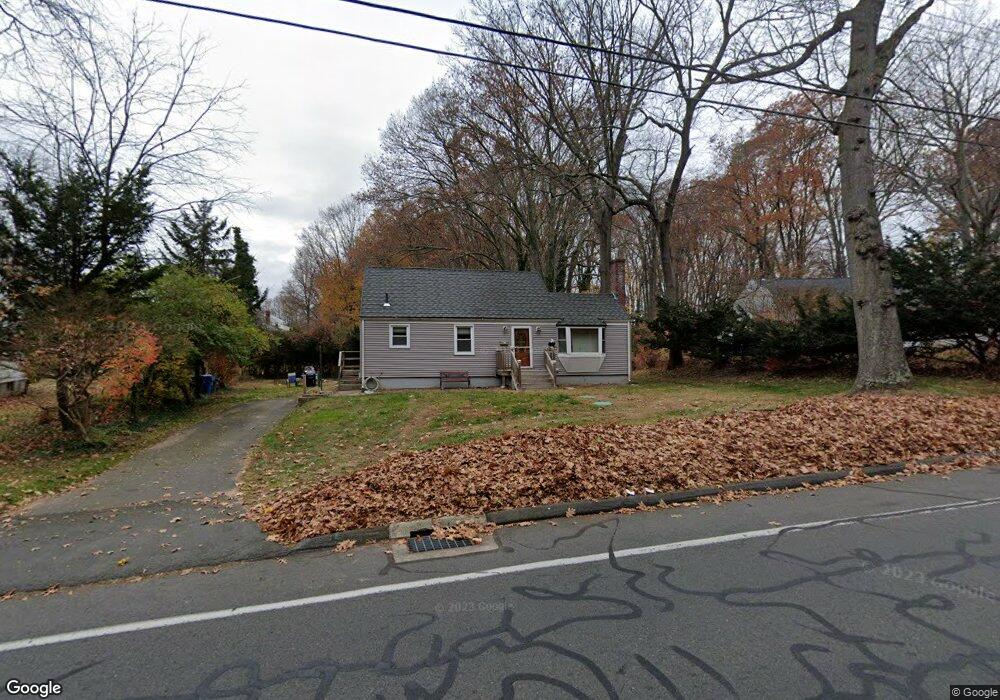
150 Greenwood Dr Manchester, CT 06042
Buckley District NeighborhoodEstimated Value: $282,000 - $339,000
4
Beds
1
Bath
1,326
Sq Ft
$235/Sq Ft
Est. Value
About This Home
This home is located at 150 Greenwood Dr, Manchester, CT 06042 and is currently estimated at $311,672, approximately $235 per square foot. 150 Greenwood Dr is a home located in Hartford County with nearby schools including Buckley School, Illing Middle School, and Elisabeth M. Bennet Academy.
Ownership History
Date
Name
Owned For
Owner Type
Purchase Details
Closed on
Oct 27, 1997
Sold by
Hawkins Lynne B
Bought by
Tourville Thomas G and Tourville Stacy L
Current Estimated Value
Purchase Details
Closed on
Aug 3, 1987
Sold by
Hills Arthur E
Bought by
Hawkins Harold B
Create a Home Valuation Report for This Property
The Home Valuation Report is an in-depth analysis detailing your home's value as well as a comparison with similar homes in the area
Home Values in the Area
Average Home Value in this Area
Purchase History
| Date | Buyer | Sale Price | Title Company |
|---|---|---|---|
| Tourville Thomas G | $80,000 | -- | |
| Tourville Thomas G | $80,000 | -- | |
| Hawkins Harold B | $114,500 | -- |
Source: Public Records
Mortgage History
| Date | Status | Borrower | Loan Amount |
|---|---|---|---|
| Open | Hawkins Harold B | $156,500 | |
| Closed | Hawkins Harold B | $155,100 | |
| Closed | Hawkins Harold B | $30,000 |
Source: Public Records
Tax History Compared to Growth
Tax History
| Year | Tax Paid | Tax Assessment Tax Assessment Total Assessment is a certain percentage of the fair market value that is determined by local assessors to be the total taxable value of land and additions on the property. | Land | Improvement |
|---|---|---|---|---|
| 2025 | $5,873 | $147,500 | $39,300 | $108,200 |
| 2024 | $5,705 | $147,500 | $39,300 | $108,200 |
| 2023 | $5,487 | $147,500 | $39,300 | $108,200 |
| 2022 | $5,328 | $147,500 | $39,300 | $108,200 |
| 2021 | $4,847 | $115,600 | $33,700 | $81,900 |
| 2020 | $4,840 | $115,600 | $33,700 | $81,900 |
| 2019 | $4,821 | $115,600 | $33,700 | $81,900 |
| 2018 | $4,729 | $115,600 | $33,700 | $81,900 |
| 2017 | $4,595 | $115,600 | $33,700 | $81,900 |
| 2016 | $4,575 | $115,300 | $42,800 | $72,500 |
| 2015 | $4,543 | $115,300 | $42,800 | $72,500 |
| 2014 | $4,456 | $115,300 | $42,800 | $72,500 |
Source: Public Records
Map
Nearby Homes