1501 Grover St Lynden, WA 98264
Estimated Value: $481,422 - $540,000
3
Beds
1
Bath
1,232
Sq Ft
$406/Sq Ft
Est. Value
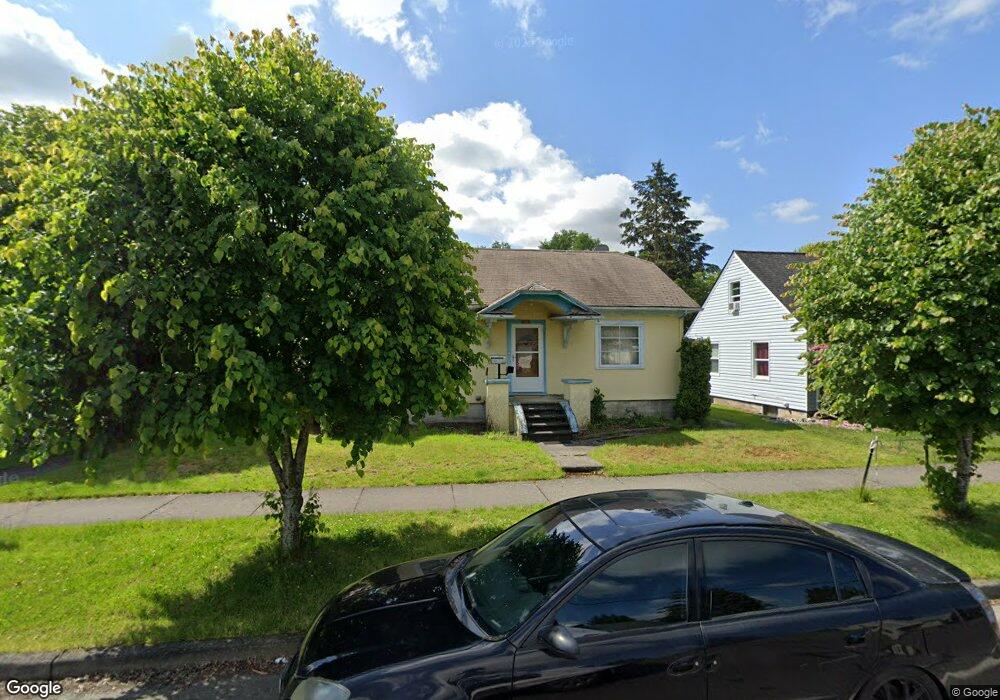
About This Home
This home is located at 1501 Grover St, Lynden, WA 98264 and is currently estimated at $500,106, approximately $405 per square foot. 1501 Grover St is a home located in Whatcom County with nearby schools including Lynden High School, Lynden Christian School, and Lynden Christian Schools: Administration.
Ownership History
Date
Name
Owned For
Owner Type
Purchase Details
Closed on
Jul 28, 2006
Sold by
Snapper Karla Kae
Bought by
Snapper Matthew Alan and Snapper Karla Kae
Current Estimated Value
Purchase Details
Closed on
Nov 10, 2003
Sold by
Dejong John Y
Bought by
Snapper Karla K
Purchase Details
Closed on
Apr 28, 2000
Sold by
Dejong Patricia A and Dejong John Y
Bought by
Dejong John Y
Create a Home Valuation Report for This Property
The Home Valuation Report is an in-depth analysis detailing your home's value as well as a comparison with similar homes in the area
Home Values in the Area
Average Home Value in this Area
Purchase History
| Date | Buyer | Sale Price | Title Company |
|---|---|---|---|
| Snapper Matthew Alan | -- | None Available | |
| Snapper Karla K | -- | -- | |
| Dejong John Y | -- | -- |
Source: Public Records
Tax History Compared to Growth
Tax History
| Year | Tax Paid | Tax Assessment Tax Assessment Total Assessment is a certain percentage of the fair market value that is determined by local assessors to be the total taxable value of land and additions on the property. | Land | Improvement |
|---|---|---|---|---|
| 2024 | $3,102 | $434,043 | $196,425 | $237,618 |
| 2023 | $3,102 | $430,979 | $202,500 | $228,479 |
| 2022 | $2,208 | $289,311 | $109,660 | $179,651 |
| 2021 | $2,165 | $239,097 | $90,627 | $148,470 |
| 2020 | $1,898 | $213,485 | $80,919 | $132,566 |
| 2019 | $1,688 | $195,816 | $74,297 | $121,519 |
| 2018 | $1,845 | $178,562 | $67,682 | $110,880 |
| 2017 | $1,755 | $160,274 | $60,750 | $99,524 |
| 2016 | $1,659 | $162,156 | $55,000 | $107,156 |
| 2015 | $1,471 | $152,412 | $52,900 | $99,512 |
| 2014 | -- | $147,247 | $51,100 | $96,147 |
| 2013 | -- | $146,147 | $50,000 | $96,147 |
Source: Public Records
Map
Nearby Homes
- 1510 E St
- 2016 Steelhead Way
- 1218 Front St
- 1717 E St
- 314 S 16th St
- 210 Stremler Dr
- 403 17th St
- 106 Fairside Dr Unit D
- 0 Guide Meridian Unit NWM2369980
- 915 Front St
- 908 Liberty St
- 410 10th St
- 1774 Farmview Terrace
- 1710 Farmview Terrace
- 515 17th St
- 1584 Main St
- 706 Judson St Unit B
- 706 Judson St Unit A
- 1882 Front St Unit B208
- 1882 Front St Unit B111