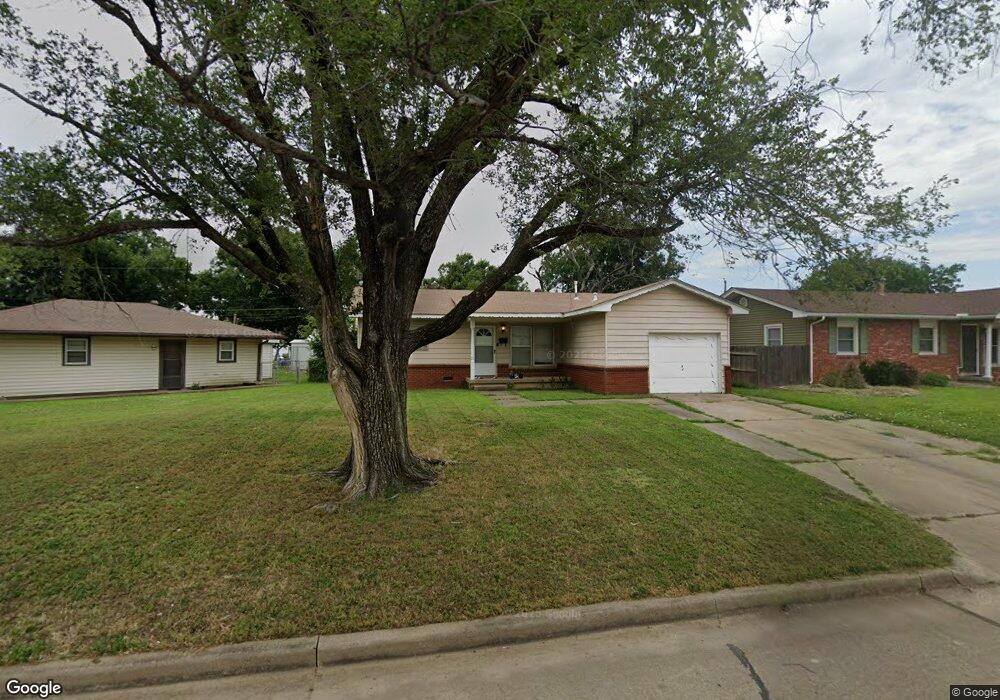
1502 Richway Dr Ponca City, OK 74601
Estimated Value: $75,000 - $83,000
3
Beds
1
Bath
873
Sq Ft
$92/Sq Ft
Est. Value
About This Home
This home is located at 1502 Richway Dr, Ponca City, OK 74601 and is currently estimated at $80,179, approximately $91 per square foot. 1502 Richway Dr is a home located in Kay County with nearby schools including Liberty Elementary School, Ponca City West Middle School, and Ponca City East Middle School.
Ownership History
Date
Name
Owned For
Owner Type
Purchase Details
Closed on
Mar 14, 2016
Sold by
Shurls Karen and Shurts Willis D
Bought by
Barkley Tom and Barkley Martha
Current Estimated Value
Home Financials for this Owner
Home Financials are based on the most recent Mortgage that was taken out on this home.
Original Mortgage
$45,900
Outstanding Balance
$2,731
Interest Rate
3.79%
Mortgage Type
Commercial
Estimated Equity
$77,448
Purchase Details
Closed on
Dec 27, 2006
Sold by
Olmstead Dana
Bought by
Gerding Kristie
Home Financials for this Owner
Home Financials are based on the most recent Mortgage that was taken out on this home.
Original Mortgage
$50,090
Interest Rate
6.27%
Mortgage Type
FHA
Purchase Details
Closed on
Oct 1, 2002
Sold by
Laura K Dobson
Bought by
Dana Olmstead
Purchase Details
Closed on
Jul 13, 2000
Sold by
Tracy Wages
Bought by
Laura K Dobson
Purchase Details
Closed on
May 28, 1999
Sold by
Keith Lawrence
Bought by
Tracy D Wages
Create a Home Valuation Report for This Property
The Home Valuation Report is an in-depth analysis detailing your home's value as well as a comparison with similar homes in the area
Home Values in the Area
Average Home Value in this Area
Purchase History
| Date | Buyer | Sale Price | Title Company |
|---|---|---|---|
| Barkley Tom | $51,000 | None Available | |
| Gerding Kristie | $50,000 | -- | |
| Dana Olmstead | $45,000 | -- | |
| Laura K Dobson | $42,000 | -- | |
| Tracy D Wages | $39,000 | -- |
Source: Public Records
Mortgage History
| Date | Status | Borrower | Loan Amount |
|---|---|---|---|
| Open | Barkley Tom | $45,900 | |
| Previous Owner | Gerding Kristie | $50,090 |
Source: Public Records
Tax History Compared to Growth
Tax History
| Year | Tax Paid | Tax Assessment Tax Assessment Total Assessment is a certain percentage of the fair market value that is determined by local assessors to be the total taxable value of land and additions on the property. | Land | Improvement |
|---|---|---|---|---|
| 2024 | $580 | $6,131 | $778 | $5,353 |
| 2023 | $580 | $5,839 | $778 | $5,061 |
| 2022 | $529 | $5,561 | $778 | $4,783 |
| 2021 | $532 | $5,561 | $778 | $4,783 |
| 2020 | $526 | $5,561 | $778 | $4,783 |
| 2019 | $512 | $5,359 | $778 | $4,581 |
| 2018 | $525 | $5,417 | $778 | $4,639 |
| 2017 | $550 | $5,610 | $778 | $4,832 |
| 2016 | $482 | $4,867 | $778 | $4,089 |
| 2015 | $384 | $4,857 | $778 | $4,079 |
| 2014 | $380 | $4,894 | $778 | $4,116 |
Source: Public Records
Map
Nearby Homes
- 1708 Potomac Dr
- 1021 Riviera Dr
- 941 N Ash St
- 1217 N Pine St
- 1016 N Oak St
- 113 E Fresno Ave
- 1008 N 1st St
- 745 N Lake St
- 726 N Lake St
- 304 E Detroit Ave
- 0000 N Union St
- 1035 N Sunset St
- 505 N Pine St
- 2005 N 4th St
- 508 N Birch St
- 2000 N 5th St
- 734 N 2nd St
- 400 Hampton Dr
- 1504 W Broadway Ave
- 1412 Donahoe Dr
- 1504 Richway Dr
- 1500 Richway Dr
- 1508 Richway Dr
- 1501 Richway Dr
- 1512 Richway Dr
- 1505 Richway Dr
- 816 W Emporia Ave
- 1509 Richway Dr
- 812 W Emporia Ave
- 1516 Richway Dr
- 1513 Richway Dr
- Investor Bundle N Ash
- 808 W Emporia Ave
- 1517 Richway Dr
- 1600 Richway Dr
- 1500 Potomac Dr
- 1504 Potomac Dr
- 804 W Emporia Ave
- 1508 Potomac Dr
- 1601 Richway Dr