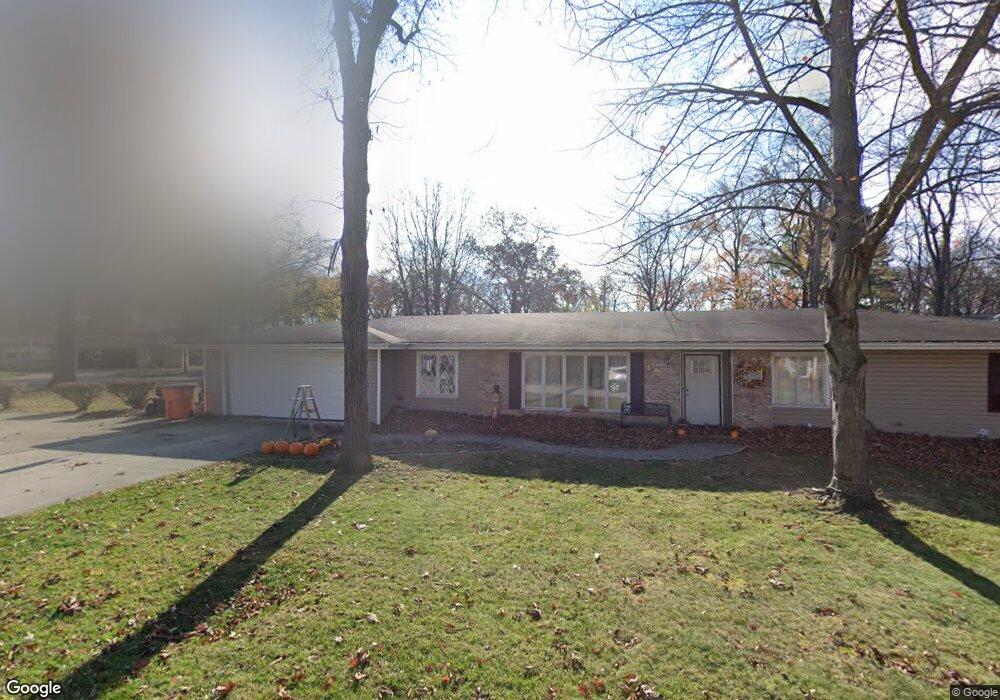
1503 Hickory Hill Dr Effingham, IL 62401
Estimated Value: $227,450 - $402,000
3
Beds
3
Baths
1,700
Sq Ft
$160/Sq Ft
Est. Value
About This Home
This home is located at 1503 Hickory Hill Dr, Effingham, IL 62401 and is currently estimated at $272,613, approximately $160 per square foot. 1503 Hickory Hill Dr is a home located in Effingham County with nearby schools including South Side Grade School, Early Learning Center, and Central Grade School.
Ownership History
Date
Name
Owned For
Owner Type
Purchase Details
Closed on
Jun 13, 2016
Sold by
Reed Brandon E and Reed Ashley J
Bought by
Junghanel Jacob and Junghanel Kerri
Current Estimated Value
Home Financials for this Owner
Home Financials are based on the most recent Mortgage that was taken out on this home.
Original Mortgage
$139,434
Outstanding Balance
$111,298
Interest Rate
3.66%
Mortgage Type
VA
Estimated Equity
$161,315
Purchase Details
Closed on
Apr 17, 2008
Sold by
Helm James L and Helm Renee
Bought by
Reed Brandon E and Gilbert Ashley J
Home Financials for this Owner
Home Financials are based on the most recent Mortgage that was taken out on this home.
Original Mortgage
$107,000
Interest Rate
5.88%
Mortgage Type
New Conventional
Create a Home Valuation Report for This Property
The Home Valuation Report is an in-depth analysis detailing your home's value as well as a comparison with similar homes in the area
Home Values in the Area
Average Home Value in this Area
Purchase History
| Date | Buyer | Sale Price | Title Company |
|---|---|---|---|
| Junghanel Jacob | $138,000 | None Available | |
| Reed Brandon E | $125,000 | None Available |
Source: Public Records
Mortgage History
| Date | Status | Borrower | Loan Amount |
|---|---|---|---|
| Open | Junghanel Jacob | $139,434 | |
| Previous Owner | Reed Brandon E | $107,000 |
Source: Public Records
Tax History Compared to Growth
Tax History
| Year | Tax Paid | Tax Assessment Tax Assessment Total Assessment is a certain percentage of the fair market value that is determined by local assessors to be the total taxable value of land and additions on the property. | Land | Improvement |
|---|---|---|---|---|
| 2024 | $3,866 | $63,230 | $16,960 | $46,270 |
| 2023 | $3,505 | $57,480 | $15,420 | $42,060 |
| 2022 | $3,262 | $52,740 | $14,150 | $38,590 |
| 2021 | $3,352 | $52,220 | $14,010 | $38,210 |
| 2020 | $3,280 | $50,750 | $13,620 | $37,130 |
| 2019 | $3,213 | $50,250 | $13,490 | $36,760 |
| 2018 | $3,093 | $48,320 | $12,970 | $35,350 |
| 2017 | $3,032 | $47,380 | $12,720 | $34,660 |
| 2016 | $2,955 | $46,000 | $12,350 | $33,650 |
| 2015 | -- | $43,810 | $8,220 | $35,590 |
| 2014 | -- | $46,620 | $7,980 | $38,640 |
| 2013 | -- | $45,700 | $7,820 | $37,880 |
| 2012 | -- | $45,020 | $7,700 | $37,320 |
Source: Public Records
Map
Nearby Homes
- 1006 N Koester Dr
- 0 S Lakewood Dr
- 0 Augusta National Dr Unit 6255461
- 1600 W Fayette Ave
- 1201 N Martin St
- 406 W Kentucky Ave
- 505 W Evergreen Ave
- 702 W Fayette Ave
- 1105 N Merchant St
- 710 W Richland Ave
- 407 W Edgar Ave
- 100 E Temple Ave
- 601 S Maple St
- 2310 N Raney St
- 1207 Cliffview Dr
- 2321 Lilly St
- 914 Oakcrest Dr
- 1200 Cliffview Dr
- 1309 Cliffview Dr
- 801 N Cleveland St
- 1505 Hickory Hill Dr
- 1500 Hickory Hill Dr
- 1405 Hickory Hill Dr
- 1504 Hickory Hill Dr
- 1510 Hickory Hill Dr
- 1512 Hickory Hill Dr
- 808 Hickory Hill Dr
- 1506 Hickory Hill Dr
- 1406 Hickory Hill Dr
- 1403 Hickory Hill Dr
- 804 Hickory Hill Dr
- 903 N Keller Dr
- 1404 Hickory Hill Dr
- 1508 Hickory Hill Dr
- 1514 Hickory Hill Dr
- 809 N Keller Dr
- 802 Hickory Hill Dr
- 807 N Keller Dr
- 805 N Keller Dr Unit 809
- 1508 Marvon Dr