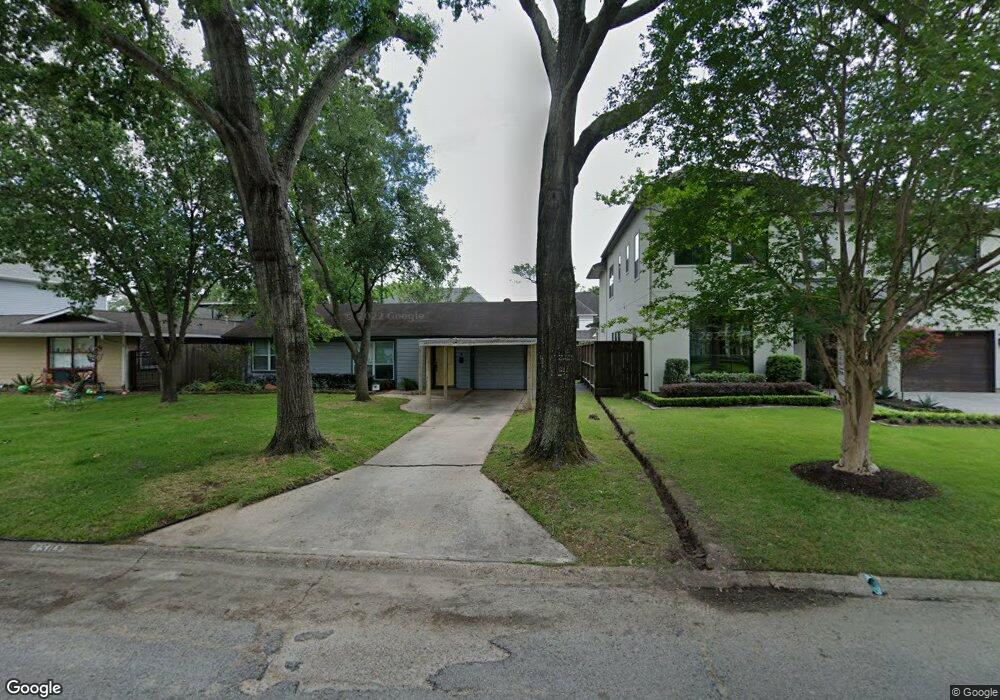
1503 Martin St Houston, TX 77018
Oak Forest-Garden Oaks NeighborhoodEstimated Value: $573,000 - $813,000
3
Beds
2
Baths
1,173
Sq Ft
$555/Sq Ft
Est. Value
About This Home
This home is located at 1503 Martin St, Houston, TX 77018 and is currently estimated at $650,815, approximately $554 per square foot. 1503 Martin St is a home located in Harris County with nearby schools including Oak Forest Elementary School, Frank Black Middle School, and Waltrip High School.
Ownership History
Date
Name
Owned For
Owner Type
Purchase Details
Closed on
May 22, 2006
Sold by
Boatwright Timothy J
Bought by
Corrigan Ann
Current Estimated Value
Home Financials for this Owner
Home Financials are based on the most recent Mortgage that was taken out on this home.
Original Mortgage
$106,000
Outstanding Balance
$61,391
Interest Rate
6.4%
Mortgage Type
Purchase Money Mortgage
Estimated Equity
$589,424
Purchase Details
Closed on
Jun 26, 2000
Sold by
Artigo Daniel T
Bought by
Boatwright Timothy J
Home Financials for this Owner
Home Financials are based on the most recent Mortgage that was taken out on this home.
Original Mortgage
$69,200
Interest Rate
8.66%
Purchase Details
Closed on
Aug 25, 1997
Sold by
Arenas William B and Arenas Therese
Bought by
Artigo Daniel T
Home Financials for this Owner
Home Financials are based on the most recent Mortgage that was taken out on this home.
Original Mortgage
$66,462
Interest Rate
7.46%
Mortgage Type
FHA
Create a Home Valuation Report for This Property
The Home Valuation Report is an in-depth analysis detailing your home's value as well as a comparison with similar homes in the area
Home Values in the Area
Average Home Value in this Area
Purchase History
| Date | Buyer | Sale Price | Title Company |
|---|---|---|---|
| Corrigan Ann | -- | Charter Title Company | |
| Boatwright Timothy J | -- | -- | |
| Artigo Daniel T | -- | Regency Title |
Source: Public Records
Mortgage History
| Date | Status | Borrower | Loan Amount |
|---|---|---|---|
| Open | Corrigan Ann | $106,000 | |
| Previous Owner | Boatwright Timothy J | $69,200 | |
| Previous Owner | Artigo Daniel T | $66,462 | |
| Closed | Boatwright Timothy J | $8,650 |
Source: Public Records
Tax History Compared to Growth
Tax History
| Year | Tax Paid | Tax Assessment Tax Assessment Total Assessment is a certain percentage of the fair market value that is determined by local assessors to be the total taxable value of land and additions on the property. | Land | Improvement |
|---|---|---|---|---|
| 2025 | $7,505 | $550,263 | $468,547 | $81,716 |
| 2024 | $7,505 | $519,903 | $468,547 | $51,356 |
| 2023 | $7,505 | $485,409 | $433,051 | $52,358 |
| 2022 | $9,087 | $441,894 | $397,555 | $44,339 |
| 2021 | $8,744 | $390,649 | $340,762 | $49,887 |
| 2020 | $8,259 | $368,942 | $319,464 | $49,478 |
| 2019 | $7,846 | $347,644 | $298,166 | $49,478 |
| 2018 | $5,433 | $331,399 | $283,968 | $47,431 |
| 2017 | $6,480 | $331,399 | $283,968 | $47,431 |
| 2016 | $5,891 | $331,399 | $283,968 | $47,431 |
| 2015 | $3,800 | $306,380 | $248,472 | $57,908 |
| 2014 | $3,800 | $266,071 | $227,174 | $38,897 |
Source: Public Records
Map
Nearby Homes
- 1514 Chantilly Ln
- 1522 Hewitt Dr
- 1419 Richelieu Ln
- 1611 Richelieu Ln
- 1623 Latexo Dr
- 1407 Martin St
- 1519 Candlelight Ln
- 1515 Thornton Rd
- 1527 Thornton Rd
- 1634 Latexo Dr
- 1353 Chantilly Ln
- 1506 W 43rd St
- 1570 Cheshire Ln
- 1402 Hewitt Dr
- 1622 Candlelight Ln
- 4902 Oak Forest Dr
- 1341 Candlelight Ln
- 1441 Chamboard Ln
- 1330 Richelieu Ln
- 1310 Chantilly Ln
- 1463 Martin St
- 1507 Martin St
- 1459 Martin St
- 1511 Martin St
- 1502 Cheshire Ln
- 1506 Cheshire Ln
- 1454 Cheshire Ln
- 1510 Cheshire Ln
- 1502 Martin St
- 1455 Martin St
- 1515 Martin St
- 1506 Martin St
- 1450 Cheshire Ln
- 1514 Cheshire Ln
- 1502 Latexo Dr
- 1516 Martin St
- 1451 Martin St
- 1509 Latexo Dr
- 1519 Martin St
- 1446 Cheshire Ln