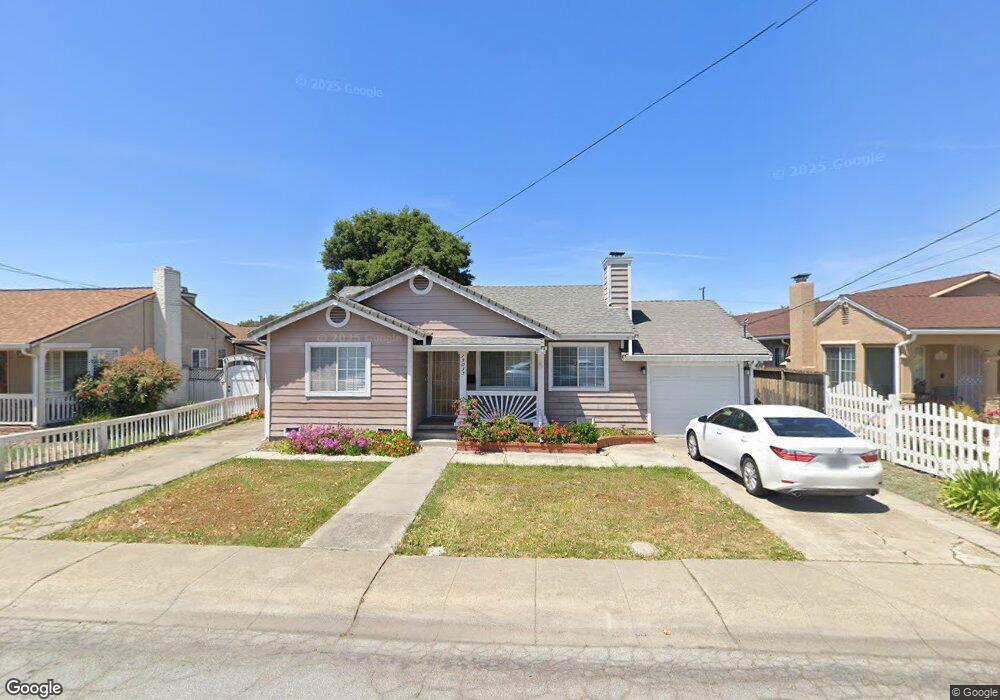
15035 Crosby St San Leandro, CA 94579
Washington Manor-Bonaire NeighborhoodEstimated Value: $680,000 - $761,000
2
Beds
1
Bath
924
Sq Ft
$786/Sq Ft
Est. Value
About This Home
This home is located at 15035 Crosby St, San Leandro, CA 94579 and is currently estimated at $725,839, approximately $785 per square foot. 15035 Crosby St is a home located in Alameda County with nearby schools including Dayton Elementary School, Washington Manor Middle School, and Arroyo High School.
Ownership History
Date
Name
Owned For
Owner Type
Purchase Details
Closed on
Mar 21, 2011
Sold by
California Housing Finance Agency
Bought by
Hui Eric M and Tong Deanna S
Current Estimated Value
Purchase Details
Closed on
Nov 15, 2010
Sold by
Toro Michael and Espinosa Sally
Bought by
California Housing Finance Agency
Purchase Details
Closed on
Aug 27, 2007
Sold by
Mcnally Kevin B and Mcnally Lori A
Bought by
Toro Michael and Espinosa Sally
Home Financials for this Owner
Home Financials are based on the most recent Mortgage that was taken out on this home.
Original Mortgage
$435,530
Interest Rate
6.74%
Mortgage Type
New Conventional
Purchase Details
Closed on
Jul 24, 2007
Sold by
Espinosa Arthur F and Espinosa Jessie L
Bought by
Mcnally Kevin B and Mcnally Lori A
Home Financials for this Owner
Home Financials are based on the most recent Mortgage that was taken out on this home.
Original Mortgage
$435,530
Interest Rate
6.74%
Mortgage Type
New Conventional
Create a Home Valuation Report for This Property
The Home Valuation Report is an in-depth analysis detailing your home's value as well as a comparison with similar homes in the area
Home Values in the Area
Average Home Value in this Area
Purchase History
| Date | Buyer | Sale Price | Title Company |
|---|---|---|---|
| Hui Eric M | $260,000 | Lawyers Title | |
| California Housing Finance Agency | $466,579 | First American Title Insuran | |
| Toro Michael | $449,000 | Old Republic Title Company | |
| Mcnally Kevin B | -- | Old Republic Title Company |
Source: Public Records
Mortgage History
| Date | Status | Borrower | Loan Amount |
|---|---|---|---|
| Previous Owner | Toro Michael | $435,530 | |
| Previous Owner | Mcnally Kevin B | $13,470 |
Source: Public Records
Tax History Compared to Growth
Tax History
| Year | Tax Paid | Tax Assessment Tax Assessment Total Assessment is a certain percentage of the fair market value that is determined by local assessors to be the total taxable value of land and additions on the property. | Land | Improvement |
|---|---|---|---|---|
| 2025 | $4,553 | $333,085 | $99,925 | $233,160 |
| 2024 | $4,553 | $326,557 | $97,967 | $228,590 |
| 2023 | $4,542 | $320,155 | $96,046 | $224,109 |
| 2022 | $4,467 | $313,878 | $94,163 | $219,715 |
| 2021 | $4,339 | $307,724 | $92,317 | $215,407 |
| 2020 | $4,238 | $304,571 | $91,371 | $213,200 |
| 2019 | $4,237 | $298,601 | $89,580 | $209,021 |
| 2018 | $3,970 | $292,748 | $87,824 | $204,924 |
| 2017 | $3,789 | $287,010 | $86,103 | $200,907 |
| 2016 | $3,695 | $281,384 | $84,415 | $196,969 |
| 2015 | $3,613 | $277,160 | $83,148 | $194,012 |
| 2014 | $3,550 | $271,730 | $81,519 | $190,211 |
Source: Public Records
Map
Nearby Homes
- 688 Garside Ct
- 15009 Kesterson St
- 15049 Kesterson St
- 619 Beatrice St
- 700 Fargo Ave Unit 2
- 700 Fargo Ave Unit 5
- 700 Fargo Ave Unit 12
- 700 Fargo Ave Unit 1
- 720 Fargo Ave Unit 14
- 650 Fargo Ave Unit 4
- 670 Fargo Ave Unit 5
- 391 Anza Way
- 747 Lewelling Blvd
- 747 Lewelling Blvd Unit SPC 22
- 15356 Sullivan Ave
- 15102 Chapel Ct
- 874 Lewelling Blvd
- 829 Crespi Dr
- 1311 Hubbard Ave
- 15382 Andover St
- 15035 Crosby St
- 15027 Crosby St
- 15043 Crosby St
- 15036 Endicott St
- 15044 Endicott St
- 15028 Endicott St
- 15051 Crosby St
- 15019 Crosby St
- 15052 Endicott St
- 15032 Crosby St
- 15040 Crosby St
- 15024 Crosby St
- 15059 Crosby St
- 15011 Crosby St
- 15048 Crosby St
- 15016 Crosby St
- 15012 Endicott St
- 15060 Endicott St
- 15056 Crosby St
- 15008 Crosby St