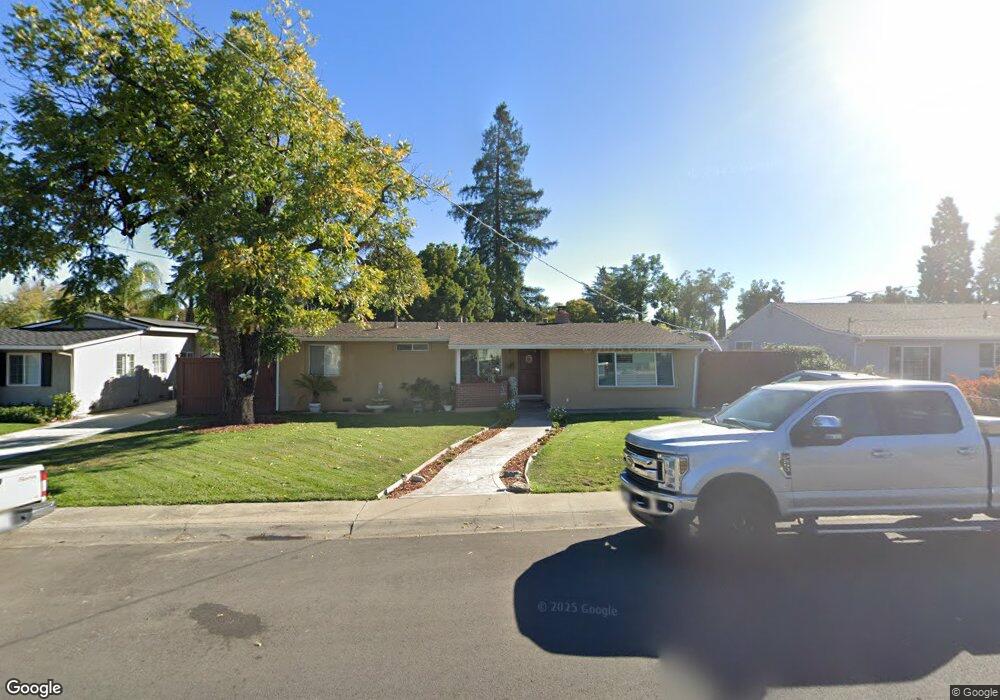
15062 Charlotte Ave San Jose, CA 95124
Blossom Crest NeighborhoodEstimated Value: $2,017,000 - $2,312,726
4
Beds
2
Baths
1,847
Sq Ft
$1,201/Sq Ft
Est. Value
About This Home
This home is located at 15062 Charlotte Ave, San Jose, CA 95124 and is currently estimated at $2,218,182, approximately $1,200 per square foot. 15062 Charlotte Ave is a home located in Santa Clara County with nearby schools including Carlton Elementary School, Union Middle School, and Leigh High School.
Ownership History
Date
Name
Owned For
Owner Type
Purchase Details
Closed on
Sep 15, 2004
Sold by
Estrella April C
Bought by
Estrella Anthony R and Estrella April C
Current Estimated Value
Home Financials for this Owner
Home Financials are based on the most recent Mortgage that was taken out on this home.
Original Mortgage
$100,000
Interest Rate
5.8%
Mortgage Type
Credit Line Revolving
Purchase Details
Closed on
Sep 16, 2003
Sold by
Scrase Judith
Bought by
Estrella Anthony R and Estrella April C
Home Financials for this Owner
Home Financials are based on the most recent Mortgage that was taken out on this home.
Original Mortgage
$465,600
Outstanding Balance
$217,921
Interest Rate
6.37%
Mortgage Type
Purchase Money Mortgage
Estimated Equity
$2,000,261
Create a Home Valuation Report for This Property
The Home Valuation Report is an in-depth analysis detailing your home's value as well as a comparison with similar homes in the area
Home Values in the Area
Average Home Value in this Area
Purchase History
| Date | Buyer | Sale Price | Title Company |
|---|---|---|---|
| Estrella Anthony R | -- | Chicago Title Co | |
| Estrella April C | -- | Chicago Title | |
| Estrella Anthony R | $582,000 | First American Title Co |
Source: Public Records
Mortgage History
| Date | Status | Borrower | Loan Amount |
|---|---|---|---|
| Closed | Estrella April C | $100,000 | |
| Open | Estrella Anthony R | $465,600 |
Source: Public Records
Tax History Compared to Growth
Tax History
| Year | Tax Paid | Tax Assessment Tax Assessment Total Assessment is a certain percentage of the fair market value that is determined by local assessors to be the total taxable value of land and additions on the property. | Land | Improvement |
|---|---|---|---|---|
| 2025 | $12,499 | $827,461 | $661,976 | $165,485 |
| 2024 | $12,499 | $811,238 | $648,997 | $162,241 |
| 2023 | $12,226 | $795,332 | $636,272 | $159,060 |
| 2022 | $11,969 | $779,739 | $623,797 | $155,942 |
| 2021 | $11,693 | $764,451 | $611,566 | $152,885 |
| 2020 | $11,374 | $756,614 | $605,296 | $151,318 |
| 2019 | $11,141 | $741,779 | $593,428 | $148,351 |
| 2018 | $10,856 | $727,236 | $581,793 | $145,443 |
| 2017 | $10,707 | $712,978 | $570,386 | $142,592 |
| 2016 | $10,212 | $698,999 | $559,202 | $139,797 |
| 2015 | $11,576 | $688,501 | $550,803 | $137,698 |
| 2014 | $10,656 | $675,015 | $540,014 | $135,001 |
Source: Public Records
Map
Nearby Homes
- 2291 Samaritan Dr Unit 3
- 4768 Hatfield Walk Unit 2
- 4787 Hatfield Walkway Unit 4
- 2303 Saidel Dr Unit 4
- 2309 Saidel Dr Unit 2
- 4593 Fallstone Ct
- 15236 Dickens Ave
- 5222 Adalina Ct
- 1957 Wilfred Way
- 15560 Camino Del Cerro
- 200 Westchester Dr
- 14802 Cole Dr
- 3949 Starview Dr
- 102 Hildebrand Dr
- 14566 S Bascom Ave
- 2026 Lynn Ave
- 4867 Anna Dr
- 4848 Anna Dr
- 116 Monte Villa Ct
- 16157 E Mozart Ave
- 15048 Charlotte Ave
- 15076 Charlotte Ave
- 15063 Cooper Ave
- 15049 Cooper Ave
- 15077 Cooper Ave
- 15034 Charlotte Ave
- 15090 Charlotte Ave
- 15063 Charlotte Ave
- 15035 Cooper Ave
- 15091 Cooper Ave
- 15049 Charlotte Ave
- 15077 Charlotte Ave
- 15104 Charlotte Ave
- 15035 Charlotte Ave
- 15018 Charlotte Ave
- 15091 Charlotte Ave
- 15105 Cooper Ave
- 15019 Cooper Ave
- 15105 Charlotte Ave
- 15019 Charlotte Ave