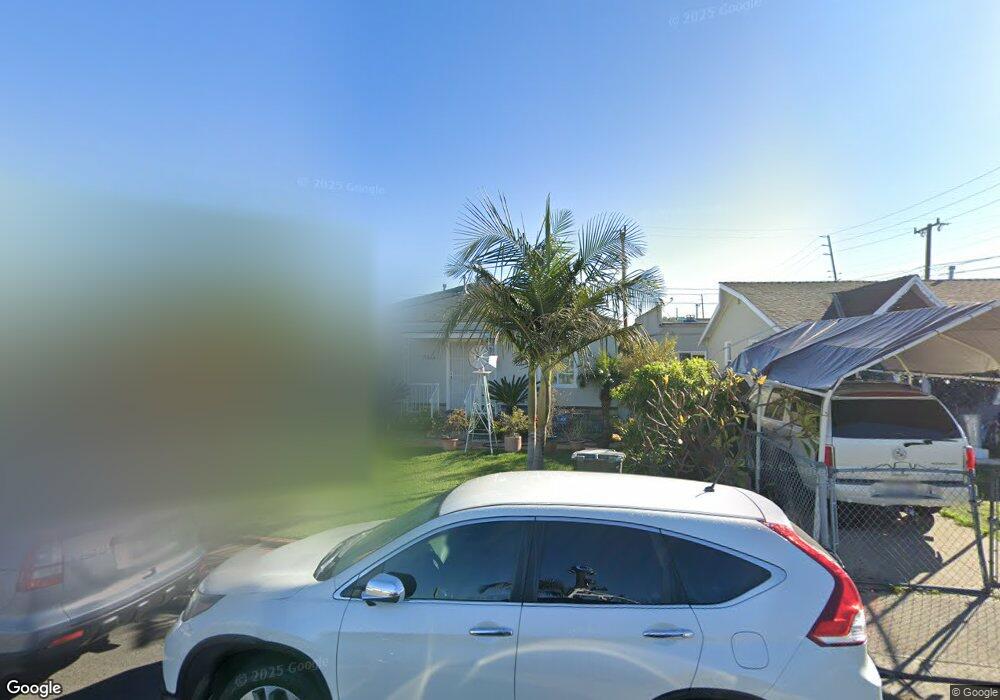
15066 Miller Ave Gardena, CA 90249
Estimated Value: $764,596 - $779,000
2
Beds
1
Bath
1,249
Sq Ft
$619/Sq Ft
Est. Value
About This Home
This home is located at 15066 Miller Ave, Gardena, CA 90249 and is currently estimated at $772,899, approximately $618 per square foot. 15066 Miller Ave is a home located in Los Angeles County with nearby schools including Chapman Elementary School, Robert E. Peary Middle School, and Gardena Senior High School.
Ownership History
Date
Name
Owned For
Owner Type
Purchase Details
Closed on
Aug 11, 1999
Sold by
Washington Mutual Bank Fsb
Bought by
Truong Huynh Hoa Thi and Nguyen Duc
Current Estimated Value
Home Financials for this Owner
Home Financials are based on the most recent Mortgage that was taken out on this home.
Original Mortgage
$131,750
Outstanding Balance
$37,328
Interest Rate
7.47%
Estimated Equity
$735,571
Purchase Details
Closed on
Feb 18, 1999
Sold by
Troncosa Joseph C
Bought by
Washington Mutual Bank Fa and Home Svgs Of America Fsb
Purchase Details
Closed on
Sep 22, 1994
Sold by
Roy Melba L
Bought by
Troncosa Joseph C and Troncosa Cynthia
Home Financials for this Owner
Home Financials are based on the most recent Mortgage that was taken out on this home.
Original Mortgage
$144,400
Interest Rate
8.54%
Create a Home Valuation Report for This Property
The Home Valuation Report is an in-depth analysis detailing your home's value as well as a comparison with similar homes in the area
Home Values in the Area
Average Home Value in this Area
Purchase History
| Date | Buyer | Sale Price | Title Company |
|---|---|---|---|
| Truong Huynh Hoa Thi | $155,000 | Chicago Title Co | |
| Washington Mutual Bank Fa | $150,000 | Stewart Title | |
| Troncosa Joseph C | $152,000 | Chicago Title |
Source: Public Records
Mortgage History
| Date | Status | Borrower | Loan Amount |
|---|---|---|---|
| Open | Truong Huynh Hoa Thi | $131,750 | |
| Previous Owner | Troncosa Joseph C | $144,400 |
Source: Public Records
Tax History Compared to Growth
Tax History
| Year | Tax Paid | Tax Assessment Tax Assessment Total Assessment is a certain percentage of the fair market value that is determined by local assessors to be the total taxable value of land and additions on the property. | Land | Improvement |
|---|---|---|---|---|
| 2025 | $3,215 | $238,206 | $190,572 | $47,634 |
| 2024 | $3,215 | $233,536 | $186,836 | $46,700 |
| 2023 | $3,159 | $228,958 | $183,173 | $45,785 |
| 2022 | $3,007 | $224,470 | $179,582 | $44,888 |
| 2021 | $2,973 | $220,069 | $176,061 | $44,008 |
| 2019 | $2,879 | $213,543 | $170,840 | $42,703 |
| 2018 | $2,792 | $209,357 | $167,491 | $41,866 |
| 2016 | $2,660 | $201,230 | $160,988 | $40,242 |
| 2015 | $2,615 | $198,208 | $158,570 | $39,638 |
| 2014 | $2,617 | $194,326 | $155,464 | $38,862 |
Source: Public Records
Map
Nearby Homes
- 14835 Wadkins Ave
- 15200 Atkinson Ave
- 14751 Wadkins Ave
- 3129 Marine Ave Unit 7
- 14623 Roxton Ave
- 2817 W 146th St
- 3245 Marine Ave
- 14526 Chadron Ave
- 2116 Marine Ave
- 14324 Chadron Ave
- 15331 Jasmine Ln Unit 105
- 3351 Marine Ave
- 15423 Van Ness Ave
- 15522 Faysmith Ave
- 14710 Parron Ave
- 15309 Patronella Ave
- 2040 W 154th St
- 2612 Manhattan Beach Blvd
- 2018 W 147th St
- 14405 Cerise Ave Unit 35
- 15050 Miller Ave
- 2715 Marine Ave
- 15067 Marigold Ave
- 15032 Miller Ave
- 15051 Marigold Ave
- 2701 Marine Ave
- 15033 Marigold Ave
- 15016 Miller Ave
- 15033 Miller Ave
- 15017 Marigold Ave
- 15000 Miller Ave
- 15017 Miller Ave
- 15001 Marigold Ave
- 2802 Marine Ave
- 2806 Marine Ave
- 2728 Marine Ave
- 15066 Marigold Ave
- 15001 Miller Ave
- 15050 Marigold Ave
- 2631 Marine Ave