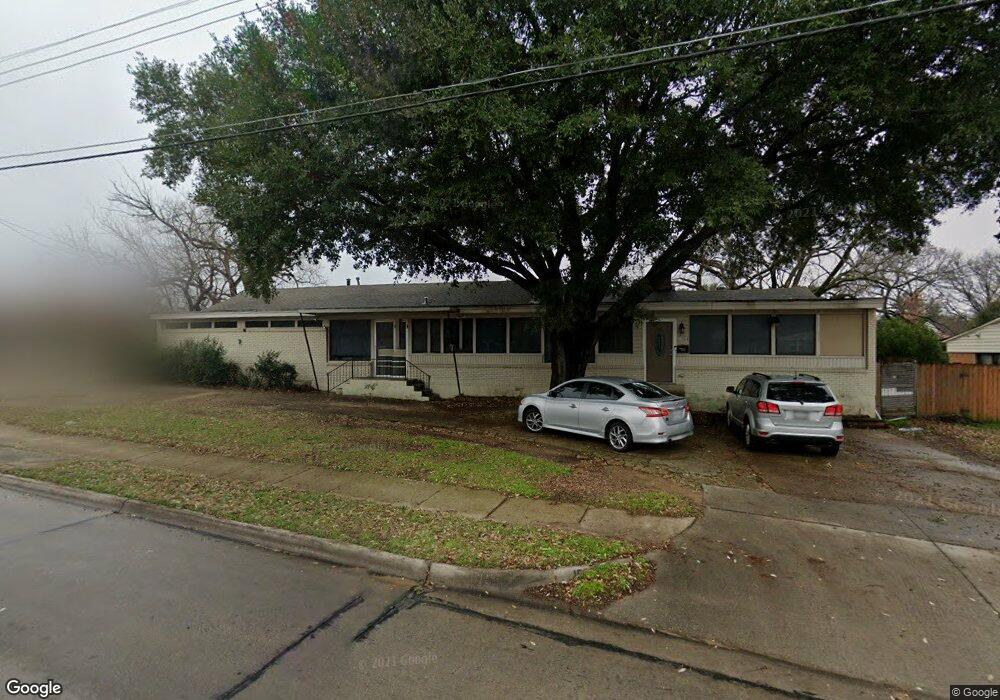
1508 W 6th St Irving, TX 75060
South Irving NeighborhoodEstimated Value: $383,110 - $442,000
4
Beds
2
Baths
3,300
Sq Ft
$126/Sq Ft
Est. Value
About This Home
This home is located at 1508 W 6th St, Irving, TX 75060 and is currently estimated at $415,778, approximately $125 per square foot. 1508 W 6th St is a home located in Dallas County with nearby schools including Haley J. Elementary School, Lorenzo De Zavala Middle, and Nimitz High School.
Ownership History
Date
Name
Owned For
Owner Type
Purchase Details
Closed on
Jun 1, 2010
Sold by
Zkb Properties Llp
Bought by
Ramirez Jose and Ramirez Doris
Current Estimated Value
Home Financials for this Owner
Home Financials are based on the most recent Mortgage that was taken out on this home.
Original Mortgage
$100,000
Outstanding Balance
$67,184
Interest Rate
5.02%
Mortgage Type
Seller Take Back
Estimated Equity
$348,594
Purchase Details
Closed on
Jan 23, 2007
Sold by
Meenach Lou Edward and Meenach Jacquie L
Bought by
Zkb Properties Llp
Create a Home Valuation Report for This Property
The Home Valuation Report is an in-depth analysis detailing your home's value as well as a comparison with similar homes in the area
Home Values in the Area
Average Home Value in this Area
Purchase History
| Date | Buyer | Sale Price | Title Company |
|---|---|---|---|
| Ramirez Jose | -- | Reunion Title | |
| Zkb Properties Llp | -- | Atc |
Source: Public Records
Mortgage History
| Date | Status | Borrower | Loan Amount |
|---|---|---|---|
| Open | Ramirez Jose | $100,000 |
Source: Public Records
Tax History Compared to Growth
Tax History
| Year | Tax Paid | Tax Assessment Tax Assessment Total Assessment is a certain percentage of the fair market value that is determined by local assessors to be the total taxable value of land and additions on the property. | Land | Improvement |
|---|---|---|---|---|
| 2025 | $3,258 | $400,080 | $47,740 | $352,340 |
| 2024 | $3,258 | $338,430 | $47,740 | $290,690 |
| 2023 | $3,258 | $250,780 | $50,000 | $200,780 |
| 2022 | $5,783 | $250,780 | $50,000 | $200,780 |
| 2021 | $5,483 | $226,720 | $40,000 | $186,720 |
| 2020 | $5,688 | $226,720 | $40,000 | $186,720 |
| 2019 | $5,985 | $225,700 | $39,980 | $185,720 |
| 2018 | $4,841 | $180,470 | $23,870 | $156,600 |
| 2017 | $4,861 | $180,470 | $23,870 | $156,600 |
| 2016 | $4,862 | $180,470 | $23,870 | $156,600 |
| 2015 | $1,887 | $104,180 | $23,870 | $80,310 |
| 2014 | $1,887 | $86,110 | $23,870 | $62,240 |
Source: Public Records
Map
Nearby Homes