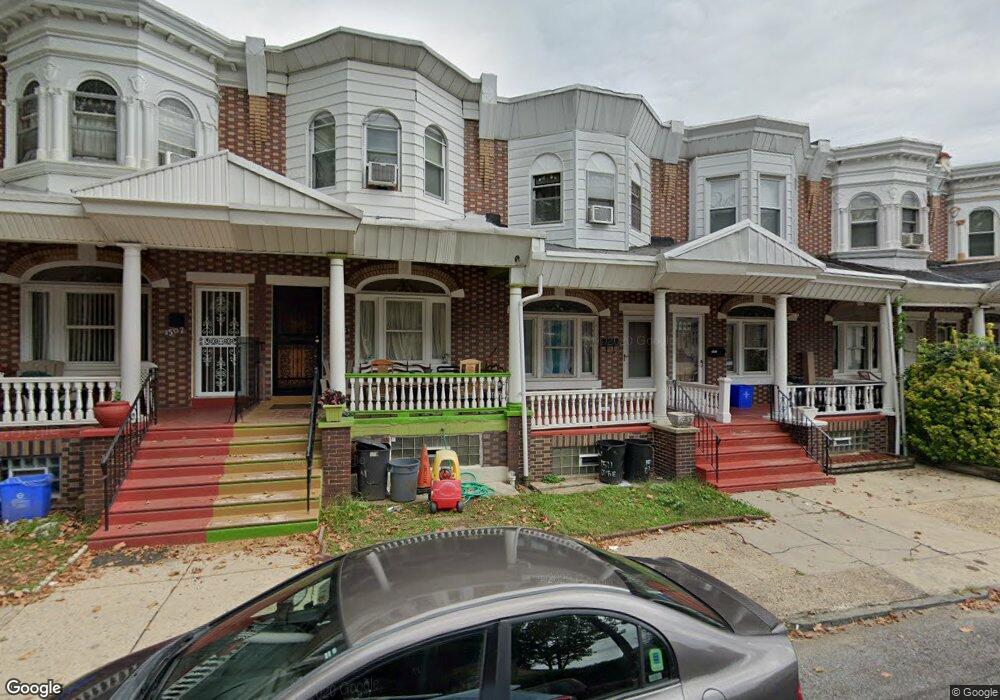
1509 Dyre St Philadelphia, PA 19124
Frankford NeighborhoodEstimated Value: $182,000 - $203,209
3
Beds
1
Bath
1,512
Sq Ft
$127/Sq Ft
Est. Value
About This Home
This home is located at 1509 Dyre St, Philadelphia, PA 19124 and is currently estimated at $192,552, approximately $127 per square foot. 1509 Dyre St is a home located in Philadelphia County with nearby schools including Frankford High School, The Philadelphia Charter School for the Arts & Sciences, and Mastery Schools Smedley Elementary.
Ownership History
Date
Name
Owned For
Owner Type
Purchase Details
Closed on
Dec 17, 1999
Sold by
Lopez Robert G and Lopez Patricia S
Bought by
Easley Andrea and Martin Lamont
Current Estimated Value
Home Financials for this Owner
Home Financials are based on the most recent Mortgage that was taken out on this home.
Original Mortgage
$45,336
Outstanding Balance
$13,693
Interest Rate
7.61%
Mortgage Type
FHA
Estimated Equity
$178,859
Create a Home Valuation Report for This Property
The Home Valuation Report is an in-depth analysis detailing your home's value as well as a comparison with similar homes in the area
Home Values in the Area
Average Home Value in this Area
Purchase History
| Date | Buyer | Sale Price | Title Company |
|---|---|---|---|
| Easley Andrea | $44,900 | -- |
Source: Public Records
Mortgage History
| Date | Status | Borrower | Loan Amount |
|---|---|---|---|
| Open | Easley Andrea | $45,336 |
Source: Public Records
Tax History Compared to Growth
Tax History
| Year | Tax Paid | Tax Assessment Tax Assessment Total Assessment is a certain percentage of the fair market value that is determined by local assessors to be the total taxable value of land and additions on the property. | Land | Improvement |
|---|---|---|---|---|
| 2026 | $1,995 | $177,600 | $35,520 | $142,080 |
| 2025 | $1,995 | $177,600 | $35,520 | $142,080 |
| 2024 | $1,995 | $177,600 | $35,520 | $142,080 |
| 2023 | $1,995 | $142,500 | $28,500 | $114,000 |
| 2022 | $782 | $97,500 | $28,500 | $69,000 |
| 2021 | $1,412 | $0 | $0 | $0 |
| 2020 | $1,412 | $0 | $0 | $0 |
| 2019 | $1,355 | $0 | $0 | $0 |
| 2018 | $833 | $0 | $0 | $0 |
| 2017 | $1,253 | $0 | $0 | $0 |
| 2016 | $833 | $0 | $0 | $0 |
| 2015 | $797 | $0 | $0 | $0 |
| 2014 | -- | $89,500 | $14,444 | $75,056 |
| 2012 | -- | $12,224 | $985 | $11,239 |
Source: Public Records
Map
Nearby Homes