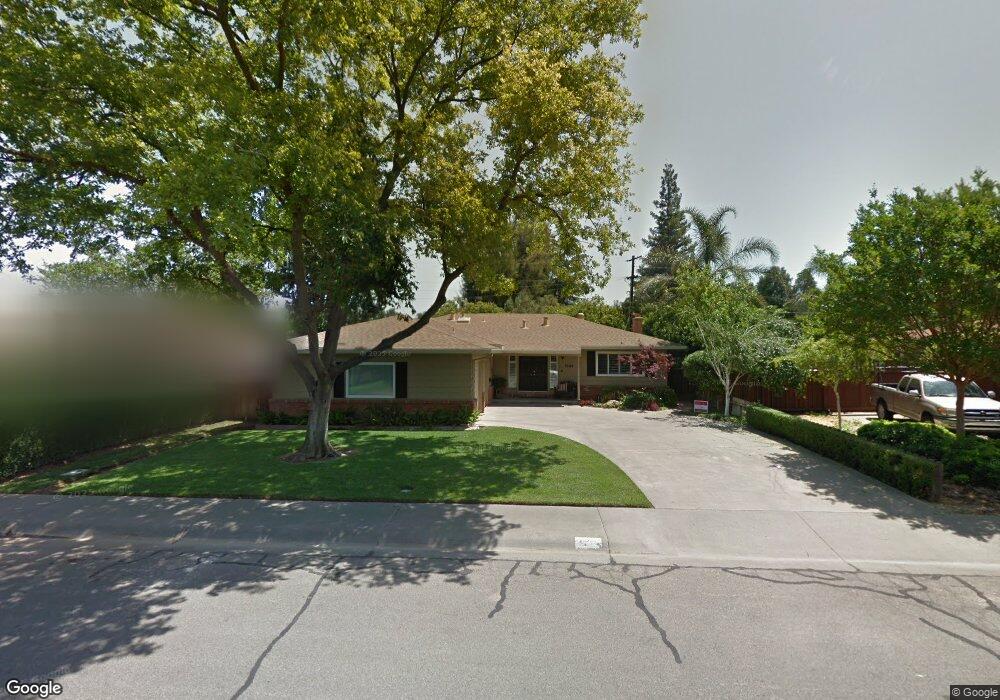
1509 Spruce Dr Woodland, CA 95695
Estimated Value: $570,322 - $631,000
4
Beds
2
Baths
2,041
Sq Ft
$296/Sq Ft
Est. Value
About This Home
This home is located at 1509 Spruce Dr, Woodland, CA 95695 and is currently estimated at $603,581, approximately $295 per square foot. 1509 Spruce Dr is a home located in Yolo County with nearby schools including Gibson Elementary School, Lee Middle School, and Woodland Senior High School.
Ownership History
Date
Name
Owned For
Owner Type
Purchase Details
Closed on
Mar 14, 2011
Sold by
Burns Mark K and Herrmann Herbert K
Bought by
Burns Mary K
Current Estimated Value
Purchase Details
Closed on
Jul 14, 2008
Sold by
Winn Derek S and Winn Suzanne J
Bought by
Winn Derek S and Winn Suzanne J
Home Financials for this Owner
Home Financials are based on the most recent Mortgage that was taken out on this home.
Original Mortgage
$356,000
Outstanding Balance
$229,666
Interest Rate
6.07%
Mortgage Type
New Conventional
Estimated Equity
$373,915
Purchase Details
Closed on
Feb 5, 2001
Sold by
Bridewell Clyde D and The Bridewell Declaration Of T
Bought by
Winn Derek S and Winn Suzie J
Home Financials for this Owner
Home Financials are based on the most recent Mortgage that was taken out on this home.
Original Mortgage
$213,750
Interest Rate
7.08%
Create a Home Valuation Report for This Property
The Home Valuation Report is an in-depth analysis detailing your home's value as well as a comparison with similar homes in the area
Home Values in the Area
Average Home Value in this Area
Purchase History
| Date | Buyer | Sale Price | Title Company |
|---|---|---|---|
| Burns Mary K | -- | None Available | |
| Winn Derek S | -- | Fidelity Natl Title Co Of Ca | |
| Winn Derek S | $225,000 | North American Title Co |
Source: Public Records
Mortgage History
| Date | Status | Borrower | Loan Amount |
|---|---|---|---|
| Open | Winn Derek S | $356,000 | |
| Closed | Winn Derek S | $213,750 |
Source: Public Records
Tax History Compared to Growth
Tax History
| Year | Tax Paid | Tax Assessment Tax Assessment Total Assessment is a certain percentage of the fair market value that is determined by local assessors to be the total taxable value of land and additions on the property. | Land | Improvement |
|---|---|---|---|---|
| 2025 | $3,421 | $339,015 | $113,000 | $226,015 |
| 2023 | $3,421 | $325,853 | $108,613 | $217,240 |
| 2022 | $3,285 | $319,465 | $106,484 | $212,981 |
| 2021 | $3,231 | $313,202 | $104,397 | $208,805 |
| 2020 | $3,184 | $309,991 | $103,327 | $206,664 |
| 2019 | $3,123 | $303,913 | $101,301 | $202,612 |
| 2018 | $3,090 | $297,955 | $99,315 | $198,640 |
| 2017 | $3,021 | $292,114 | $97,368 | $194,746 |
| 2016 | $2,968 | $286,387 | $95,459 | $190,928 |
| 2015 | $2,867 | $282,087 | $94,026 | $188,061 |
| 2014 | $2,867 | $276,563 | $92,185 | $184,378 |
Source: Public Records
Map
Nearby Homes
- 420 Delta Dr
- 1609 Mckinley Ave
- 423 El Dorado Dr
- 436 Abbey Place
- 1240 Eunice Dr
- 1328 College St
- 1208 West St
- 206 Los Robles Way
- 205 Bartlett Ave
- 1501 6th St
- 6 Southwood Dr
- 108 Clanton Ave
- 19435 East St
- 715 College St
- 221 Cross St
- 1249 Bray Dr
- 515 East St
- 845 East St
- 420 W Southwood Dr
- 608 College St Unit 8
- 1505 Spruce Dr
- 301 Monte Vista Dr
- 305 Monte Vista Dr
- 1501 Spruce Dr
- 216 Toyon Dr
- 309 Monte Vista Dr
- 217 Monte Vista Dr
- 1421 Spruce Dr
- 401 Monte Vista Dr
- 213 Monte Vista Dr
- 300 Monte Vista Dr
- 215 Toyon Dr
- 212 Toyon Dr
- 1600 Delta Dr
- 405 Monte Vista Dr
- 1417 Spruce Dr
- 1598 Spruce Dr
- 1604 Delta Dr
- 209 Monte Vista Dr
- 211 Toyon Dr