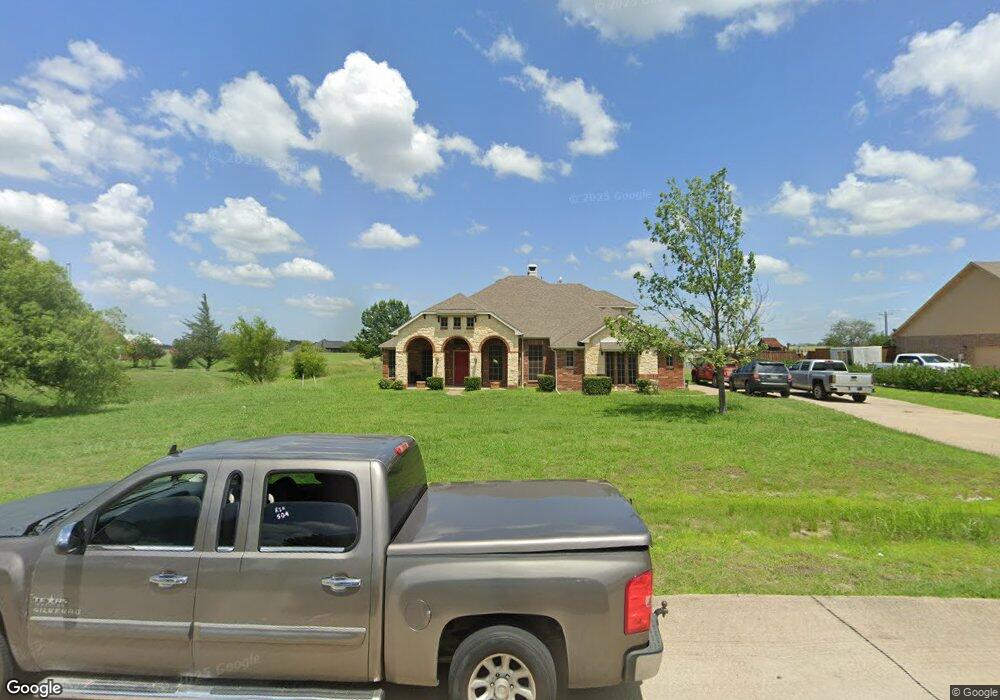
151 Alexander Ln Royse City, TX 75189
Estimated Value: $502,402 - $583,000
4
Beds
3
Baths
2,651
Sq Ft
$207/Sq Ft
Est. Value
About This Home
This home is located at 151 Alexander Ln, Royse City, TX 75189 and is currently estimated at $549,351, approximately $207 per square foot. 151 Alexander Ln is a home located in Rockwall County with nearby schools including Ruth Cherry Elementary School, Ouida Bailey Middle School, and Royse City High School.
Ownership History
Date
Name
Owned For
Owner Type
Purchase Details
Closed on
May 5, 2022
Sold by
Hill Rebecca L
Bought by
Burks Dillon G and Burks Lauren R
Current Estimated Value
Purchase Details
Closed on
Jul 17, 2006
Sold by
Altura Homes Dfw Lp
Bought by
Munoz Henry
Home Financials for this Owner
Home Financials are based on the most recent Mortgage that was taken out on this home.
Original Mortgage
$171,732
Interest Rate
6.62%
Mortgage Type
Purchase Money Mortgage
Purchase Details
Closed on
Mar 8, 2006
Sold by
Countryside Alexander Ranch Lp
Bought by
Altura Homes Dfw Lp
Home Financials for this Owner
Home Financials are based on the most recent Mortgage that was taken out on this home.
Original Mortgage
$171,732
Interest Rate
6.21%
Mortgage Type
Purchase Money Mortgage
Create a Home Valuation Report for This Property
The Home Valuation Report is an in-depth analysis detailing your home's value as well as a comparison with similar homes in the area
Home Values in the Area
Average Home Value in this Area
Purchase History
| Date | Buyer | Sale Price | Title Company |
|---|---|---|---|
| Burks Dillon G | -- | None Listed On Document | |
| Munoz Henry | -- | None Available | |
| Altura Homes Dfw Lp | -- | None Available |
Source: Public Records
Mortgage History
| Date | Status | Borrower | Loan Amount |
|---|---|---|---|
| Previous Owner | Munoz Henry | $171,732 | |
| Previous Owner | Altura Homes Dfw Lp | $171,732 |
Source: Public Records
Tax History Compared to Growth
Tax History
| Year | Tax Paid | Tax Assessment Tax Assessment Total Assessment is a certain percentage of the fair market value that is determined by local assessors to be the total taxable value of land and additions on the property. | Land | Improvement |
|---|---|---|---|---|
| 2025 | $7,570 | $570,642 | $211,200 | $359,442 |
| 2023 | $7,570 | $526,558 | $249,600 | $276,958 |
| 2022 | $7,384 | $425,470 | $149,760 | $275,710 |
| 2021 | $6,139 | $345,310 | $144,000 | $201,310 |
| 2020 | $6,581 | $347,610 | $144,000 | $203,610 |
| 2019 | $6,847 | $342,640 | $116,160 | $226,480 |
| 2018 | $6,759 | $334,620 | $105,600 | $229,020 |
| 2017 | $6,270 | $306,480 | $96,000 | $210,480 |
| 2016 | $6,079 | $297,110 | $96,000 | $201,110 |
| 2015 | $5,056 | $279,160 | $57,600 | $221,560 |
| 2014 | $5,056 | $256,870 | $57,600 | $199,270 |
Source: Public Records
Map
Nearby Homes
- 198 Mckinley Ln
- 396 Alexander Ln
- 301 Reagan Ct
- TBD N Munson Rd
- 798B N Munson Rd
- 8523 State Highway 276
- 8214 S Fm 548
- 1427 Streetman Rd
- 1428 Streetman Rd
- 9185 State Highway 276
- 5760 S Fm 548
- 2314 Laci Ln
- 0000 S Munson Rd
- LOT 2 S Munson Rd
- 3 ACS Texas 276
- 3109 Patrinia St
- 2128 St Annes Blvd
- 3250 Summerland Dr
- 9045 Palafox St
- 2021 Bayfront Dr
- 179 Alexander Ln
- 121 Alexander Ln
- 152 Alexander Ln
- 122 Alexander Ln
- 182 Alexander Ln
- 207 Alexander Ln
- 212 Alexander Ln
- 240 Alexander Ln
- 181 Mckinley Ln
- 259 Alexander Ln
- 189 Mckinley Ln
- 268 Alexander Ln
- 220 Hamilton Ct
- 232 Hamilton Ct
- 300 Alexander Ln
- 197 Mckinley Ln
- 313 Alexander Ln
- 815 Hamilton Ct
- 334 Alexander Ln
- 7685 State Highway 276