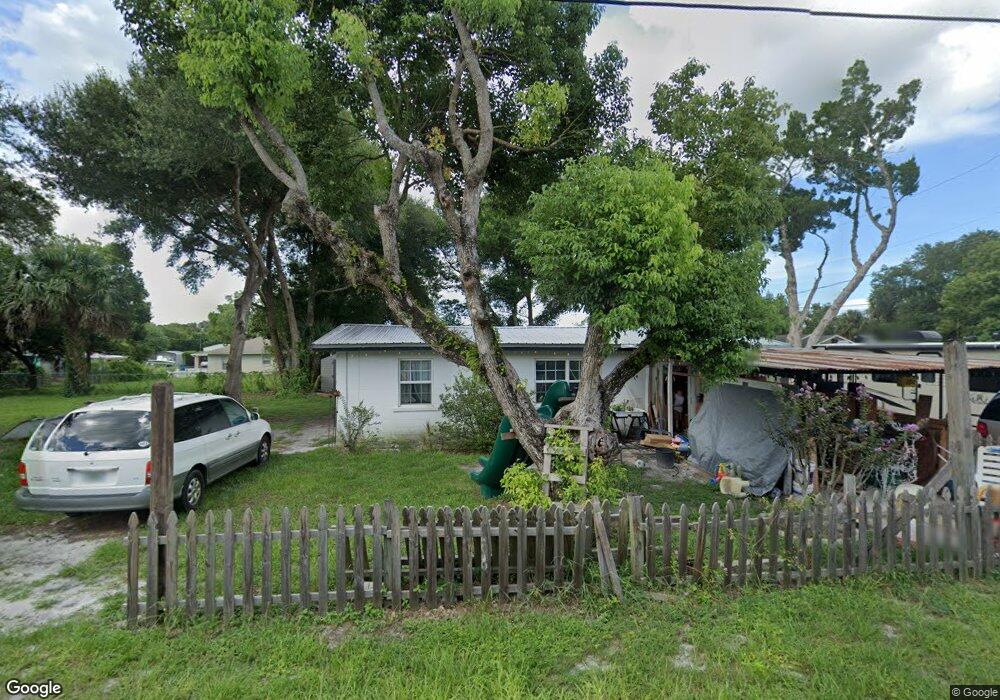
151 Grace St Unit 12 Deland, FL 32724
North DeLand NeighborhoodEstimated Value: $238,000 - $357,445
3
Beds
2
Baths
1,582
Sq Ft
$194/Sq Ft
Est. Value
About This Home
This home is located at 151 Grace St Unit 12, Deland, FL 32724 and is currently estimated at $306,611, approximately $193 per square foot. 151 Grace St Unit 12 is a home located in Volusia County with nearby schools including George W. Marks Elementary School, Deland High School, and Deland Middle School.
Ownership History
Date
Name
Owned For
Owner Type
Purchase Details
Closed on
Nov 9, 2024
Sold by
Vanhoute Lisa and Vanhoute Jeffrey
Bought by
Vanhoute Family Trust and Vanhoute
Current Estimated Value
Purchase Details
Closed on
Mar 25, 2016
Sold by
Fossnes Amanda
Bought by
Vanhoute Jeff and Vanhoute Lisa
Purchase Details
Closed on
Sep 24, 2015
Sold by
Fossnes Kristin
Bought by
Fossnes Amanda
Purchase Details
Closed on
Jun 26, 2007
Sold by
Fossnes Amanda
Bought by
Fossnes Kristin and Amanda Fossnes Irrevocable Trust
Purchase Details
Closed on
Aug 15, 1991
Bought by
Vanhoute Jeff and Vanhoute Lisa
Purchase Details
Closed on
Apr 15, 1990
Bought by
Vanhoute Jeff and Vanhoute Lisa
Purchase Details
Closed on
Mar 15, 1989
Bought by
Vanhoute Jeff and Vanhoute Lisa
Purchase Details
Closed on
Nov 15, 1986
Bought by
Vanhoute Jeff and Vanhoute Lisa
Purchase Details
Closed on
Mar 15, 1981
Bought by
Vanhoute Jeff and Vanhoute Lisa
Create a Home Valuation Report for This Property
The Home Valuation Report is an in-depth analysis detailing your home's value as well as a comparison with similar homes in the area
Home Values in the Area
Average Home Value in this Area
Purchase History
| Date | Buyer | Sale Price | Title Company |
|---|---|---|---|
| Vanhoute Family Trust | $100 | None Listed On Document | |
| Vanhoute Jeff | $142,000 | Westside Title Services Inc | |
| Fossnes Amanda | -- | Attorney | |
| Fossnes Kristin | -- | Attorney | |
| Vanhoute Jeff | $100 | -- | |
| Vanhoute Jeff | $41,000 | -- | |
| Vanhoute Jeff | $100 | -- | |
| Vanhoute Jeff | $20,000 | -- | |
| Vanhoute Jeff | $38,000 | -- |
Source: Public Records
Tax History Compared to Growth
Tax History
| Year | Tax Paid | Tax Assessment Tax Assessment Total Assessment is a certain percentage of the fair market value that is determined by local assessors to be the total taxable value of land and additions on the property. | Land | Improvement |
|---|---|---|---|---|
| 2025 | $3,031 | $182,845 | -- | -- |
| 2024 | $3,031 | $177,692 | -- | -- |
| 2023 | $3,031 | $172,517 | $0 | $0 |
| 2022 | $2,947 | $167,492 | $0 | $0 |
| 2021 | $3,032 | $162,614 | $0 | $0 |
| 2020 | $2,984 | $160,369 | $0 | $0 |
| 2019 | $3,061 | $156,763 | $0 | $0 |
| 2018 | $3,032 | $153,840 | $0 | $0 |
| 2017 | $2,633 | $134,454 | $18,061 | $116,393 |
| 2016 | $2,460 | $88,683 | $0 | $0 |
| 2015 | $1,249 | $71,629 | $0 | $0 |
| 2014 | $1,247 | $71,061 | $0 | $0 |
Source: Public Records
Map
Nearby Homes
- 124 Lake Molly Ave
- 195 Lake Molly Ave
- 7 Valencia Ct
- 4 Navel Ct
- 260 Mercers Fernery Rd
- 2200 N Clara Ave
- 460 Fernwood Dr
- 1601 N Woodland Blvd
- 425 Mercers Fernery Rd
- 305 Violetwood Rd
- 2401 N Woodland Blvd
- 0 Newport Ave
- 2945 2nd Ct
- 372 Oak Dr
- 580 Mercers Fernery Rd
- 359 Center Dr
- 0 Vacant Land Unit MFRA4667659
- 0 Vacant Land Unit MFRGC533353
- 2480 N Woodland Blvd
- 2490 N Woodland Blvd