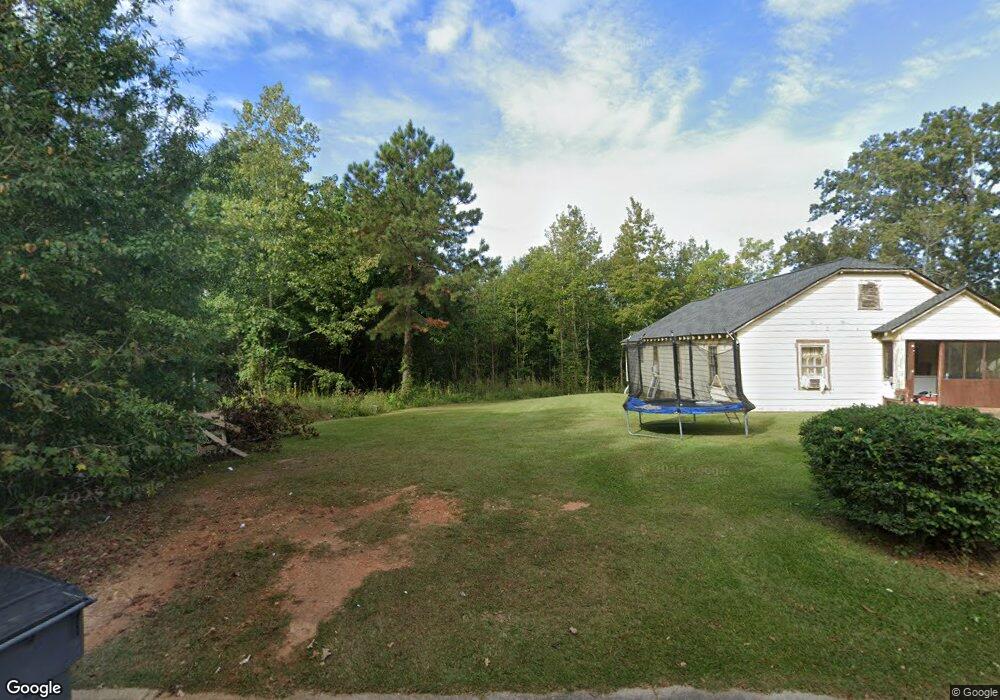
151 Mount Zion St Bremen, GA 30110
Estimated Value: $174,000 - $234,000
2
Beds
1
Bath
1,316
Sq Ft
$154/Sq Ft
Est. Value
About This Home
This home is located at 151 Mount Zion St, Bremen, GA 30110 and is currently estimated at $202,667, approximately $154 per square foot. 151 Mount Zion St is a home located in Haralson County with nearby schools including Jones Elementary School, Bremen 4th & 5th Grade Academy, and Bremen Middle School.
Ownership History
Date
Name
Owned For
Owner Type
Purchase Details
Closed on
Nov 4, 2021
Sold by
Caldwell Angela
Bought by
Hendrix Vernon R and Hendrix Patrick C
Current Estimated Value
Purchase Details
Closed on
Mar 22, 2018
Sold by
Caldwell Wanda Annice
Bought by
Caldwell Angela and Almon Meredith Caldwell
Purchase Details
Closed on
Oct 13, 2017
Sold by
Sapp Paula
Bought by
Caldwell Wanda Annice
Purchase Details
Closed on
Nov 1, 2016
Sold by
Wanda Annice
Bought by
Sapp Paula
Purchase Details
Closed on
Mar 10, 2014
Sold by
Smith Shondra
Bought by
Caldwell Wanda A
Purchase Details
Closed on
Jun 4, 2013
Sold by
City Of Bremen
Bought by
Smith Sandra and Smith Kendra
Purchase Details
Closed on
Jun 30, 2010
Sold by
Synovus Bank F/K/A Columbus Bank & Trust
Bought by
Caldwell Wanda Annice
Purchase Details
Closed on
Mar 26, 1992
Sold by
Caldwell Sam & Vivian (Mrs Sam) Life Est
Bought by
Caldwell Wanda Annice
Create a Home Valuation Report for This Property
The Home Valuation Report is an in-depth analysis detailing your home's value as well as a comparison with similar homes in the area
Home Values in the Area
Average Home Value in this Area
Purchase History
| Date | Buyer | Sale Price | Title Company |
|---|---|---|---|
| Hendrix Vernon R | -- | -- | |
| Caldwell Angela | -- | -- | |
| Caldwell Wanda Annice | $3,540 | -- | |
| Caldwell Wanda Annice | $3,540 | -- | |
| Sapp Paula | -- | -- | |
| Caldwell Wanda A | -- | -- | |
| Smith Sandra | -- | -- | |
| Caldwell Wanda Annice | -- | -- | |
| Caldwell Wanda Annice | -- | -- |
Source: Public Records
Tax History Compared to Growth
Tax History
| Year | Tax Paid | Tax Assessment Tax Assessment Total Assessment is a certain percentage of the fair market value that is determined by local assessors to be the total taxable value of land and additions on the property. | Land | Improvement |
|---|---|---|---|---|
| 2024 | $444 | $15,820 | $6,420 | $9,400 |
| 2023 | $172 | $20,485 | $8,883 | $11,602 |
| 2022 | $173 | $17,904 | $8,883 | $9,021 |
| 2021 | $176 | $17,410 | $8,883 | $8,527 |
| 2020 | $181 | $17,798 | $8,883 | $8,915 |
| 2019 | $167 | $15,941 | $8,883 | $7,058 |
| 2018 | $170 | $15,941 | $8,883 | $7,058 |
| 2017 | $186 | $15,722 | $8,883 | $6,839 |
| 2016 | $219 | $19,653 | $8,883 | $10,770 |
| 2015 | $241 | $19,327 | $8,883 | $10,444 |
| 2014 | $317 | $23,724 | $13,280 | $10,444 |
Source: Public Records
Map
Nearby Homes
- 522 Atlantic Ave
- 225 Edwards St
- 6315 Highway 78
- 0 Sewell Rd Unit 10624236
- 0 Sewell Rd Unit 7665305
- 0 Mt Zion St Unit 7399245
- 319 Stonebridge Blvd
- 321 Stonebridge Blvd
- 735 Tallapoosa St W
- 153 Crest Pointe
- 138 Crest Pointe
- 201 Stonebridge Blvd
- 305 Crest Pointe S
- 330 Kensington Cir
- 327 Crest Pointe S
- 223 Gordon St
- 4000 Highway 78
- 4711 Highway 78 Unit 235
- 148 Mount Zion St
- 172 Mount Zion St
- 179 Mount Zion St
- 126 Mount Zion St
- 123 Mount Zion St
- 156 Mount Zion St
- 134 Mount Zion St
- 189 Mount Zion St
- 116 Mount Zion St
- 106 Mount Zion St
- 107 Mount Zion St
- 348 Mount Zion St
- 237 Mount Zion St
- 136 Robinson St
- 128 Robinson St
- 138 Robinson St
- 132 Robinson St
- 142 Robinson St
- 338 Edwards St
- 247 Mount Zion St