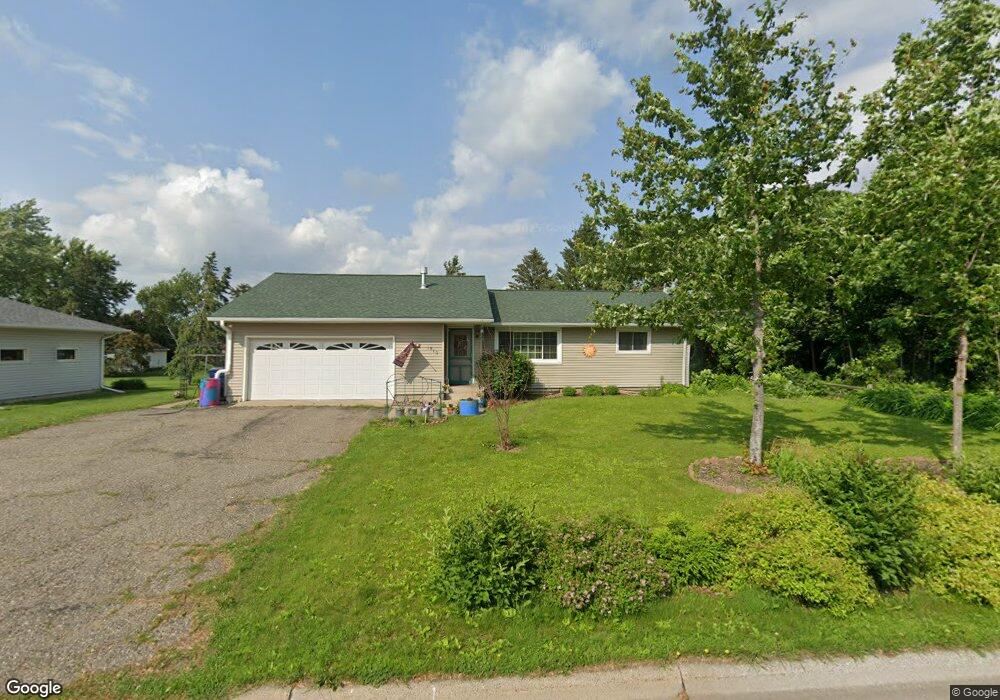
1510 N Oak St Lake City, MN 55041
Estimated Value: $227,000 - $302,000
3
Beds
2
Baths
2,400
Sq Ft
$113/Sq Ft
Est. Value
About This Home
This home is located at 1510 N Oak St, Lake City, MN 55041 and is currently estimated at $272,182, approximately $113 per square foot. 1510 N Oak St is a home located in Goodhue County with nearby schools including Bluff View Elementary School and Lincoln Secondary School.
Ownership History
Date
Name
Owned For
Owner Type
Purchase Details
Closed on
Apr 12, 2021
Sold by
Finley Patricia
Bought by
Gallentine Sharon L and Gallentine Deborah L
Current Estimated Value
Home Financials for this Owner
Home Financials are based on the most recent Mortgage that was taken out on this home.
Original Mortgage
$138,000
Outstanding Balance
$124,597
Interest Rate
3%
Mortgage Type
New Conventional
Estimated Equity
$147,585
Purchase Details
Closed on
Apr 6, 2021
Sold by
Finley Nicole L
Bought by
Finley Patricia
Home Financials for this Owner
Home Financials are based on the most recent Mortgage that was taken out on this home.
Original Mortgage
$138,000
Outstanding Balance
$124,597
Interest Rate
3%
Mortgage Type
New Conventional
Estimated Equity
$147,585
Purchase Details
Closed on
Feb 18, 2015
Sold by
Finley Patricia A
Bought by
Finley Nicole L
Purchase Details
Closed on
Dec 16, 2011
Sold by
Estate Of Harriet M Ericks and Howe Sally A
Bought by
Finley David A and Finley Patricia A
Create a Home Valuation Report for This Property
The Home Valuation Report is an in-depth analysis detailing your home's value as well as a comparison with similar homes in the area
Home Values in the Area
Average Home Value in this Area
Purchase History
| Date | Buyer | Sale Price | Title Company |
|---|---|---|---|
| Gallentine Sharon L | $160,000 | Knight Barry Title | |
| Finley Patricia | -- | Knight Barry Title | |
| Finley Nicole L | -- | Attorney | |
| Finley David A | $125,000 | -- | |
| Gallentine Sharon Sharon | $160,000 | -- |
Source: Public Records
Mortgage History
| Date | Status | Borrower | Loan Amount |
|---|---|---|---|
| Open | Gallentine Sharon L | $138,000 | |
| Closed | Gallentine Sharon Sharon | $138,000 |
Source: Public Records
Tax History Compared to Growth
Tax History
| Year | Tax Paid | Tax Assessment Tax Assessment Total Assessment is a certain percentage of the fair market value that is determined by local assessors to be the total taxable value of land and additions on the property. | Land | Improvement |
|---|---|---|---|---|
| 2025 | $2,866 | $238,900 | $43,400 | $195,500 |
| 2024 | $2,866 | $232,900 | $43,400 | $189,500 |
| 2023 | $2,790 | $216,100 | $43,400 | $172,700 |
| 2022 | $2,362 | $216,100 | $43,400 | $172,700 |
| 2021 | $2,308 | $173,200 | $43,400 | $129,800 |
| 2020 | $2,016 | $172,000 | $43,400 | $128,600 |
| 2019 | $2,098 | $153,800 | $43,400 | $110,400 |
| 2018 | $1,788 | $156,700 | $43,400 | $113,300 |
| 2017 | $1,774 | $138,600 | $43,400 | $95,200 |
| 2016 | $1,844 | $141,100 | $43,400 | $97,700 |
| 2015 | $1,820 | $142,000 | $43,400 | $98,600 |
| 2014 | -- | $135,400 | $43,400 | $92,000 |
Source: Public Records
Map
Nearby Homes
- 1401 N Lakeshore Dr Unit P2
- 1401 N Lakeshore Dr Unit 206
- 1611 N Oak St
- 1322 N 7th St
- 1702 N Lakeshore Dr Unit 8
- 1702 N Lakeshore Dr Unit 3
- 1330 N 10th St
- 1356 N 10th St
- 1247 N 10th St
- 207 W Clay St
- 825 N Oak St
- 1073 Harvest Way
- 1080 Harvest Way
- 727 Hidden Meadow Ln
- 755 Hickory Way Unit 2
- 715 Hazelnut Way
- 706-708 Hazelnut Way
- 112 Harmony Way
- 27 Kings Row Dr
- 308 W Lyon Ave
- 1510 1510 Oak-Street-n
- 1514 N Oak St
- 1504 N Oak St
- 1504 N Oak St
- 1505 N High St
- 1505 1505 High-Street-n
- 1503 N High St
- 1518 1518 N Oak St
- 1518 N Oak St
- 1509 N High St
- 1507 N Oak St
- 1501 N High St
- 1411 N High St
- 1602 1602 N Oak St
- 1408 N Oak St
- 1602 N Oak St
- 1601 N High St
- 403 W Grant St
- 1513 N Oak St
- 1405 N Oak St