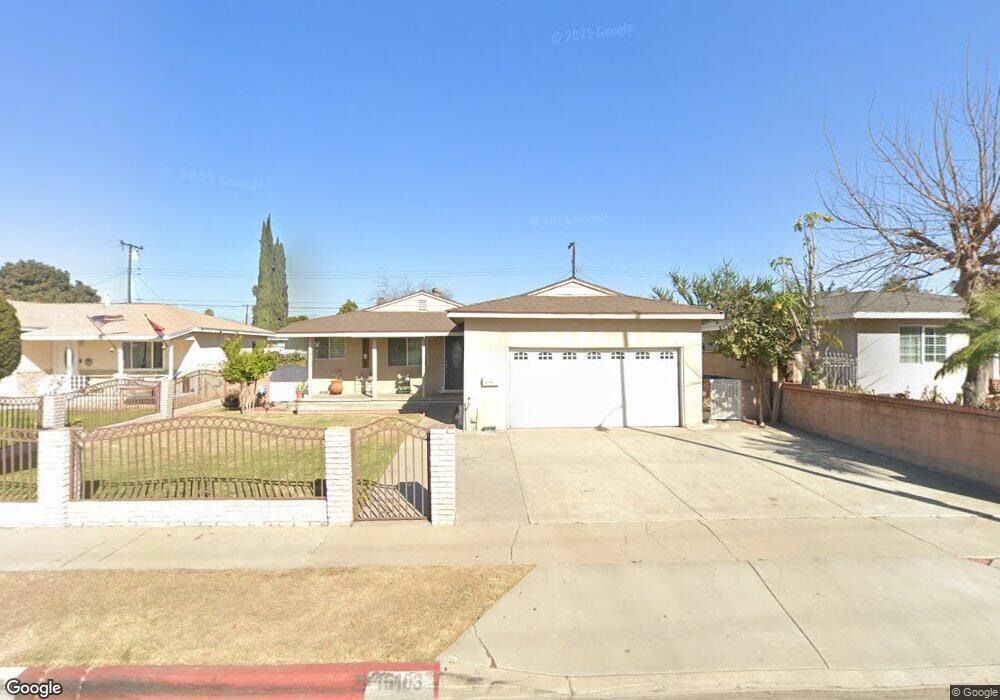
15103 Nelson Ave La Puente, CA 91744
Estimated Value: $757,000 - $777,000
3
Beds
1
Bath
1,560
Sq Ft
$490/Sq Ft
Est. Value
About This Home
This home is located at 15103 Nelson Ave, La Puente, CA 91744 and is currently estimated at $764,157, approximately $489 per square foot. 15103 Nelson Ave is a home located in Los Angeles County with nearby schools including Nelson Elementary School, Sparks Middle School, and La Puente High School.
Ownership History
Date
Name
Owned For
Owner Type
Purchase Details
Closed on
Nov 16, 1999
Sold by
Pacific Family Investment Co
Bought by
Ortega Francisco and Ortega Irene
Current Estimated Value
Home Financials for this Owner
Home Financials are based on the most recent Mortgage that was taken out on this home.
Original Mortgage
$158,902
Outstanding Balance
$47,943
Interest Rate
7.82%
Mortgage Type
FHA
Estimated Equity
$716,214
Purchase Details
Closed on
Aug 18, 1999
Sold by
Bankers Trust Company
Bought by
Pacific Family Investment Co
Purchase Details
Closed on
May 27, 1999
Sold by
Carrillo Fred J
Bought by
Greenwich Capital Acceptance Inc Series
Purchase Details
Closed on
Jan 27, 1995
Sold by
Carrillo Fred J
Bought by
Carrillo Fred J and Carrillo Mary Ellen
Home Financials for this Owner
Home Financials are based on the most recent Mortgage that was taken out on this home.
Original Mortgage
$101,250
Interest Rate
9.5%
Create a Home Valuation Report for This Property
The Home Valuation Report is an in-depth analysis detailing your home's value as well as a comparison with similar homes in the area
Home Values in the Area
Average Home Value in this Area
Purchase History
| Date | Buyer | Sale Price | Title Company |
|---|---|---|---|
| Ortega Francisco | $161,000 | Chicago Title | |
| Pacific Family Investment Co | $121,000 | Chicago Title | |
| Greenwich Capital Acceptance Inc Series | $105,000 | Fidelity National Title | |
| Carrillo Fred J | -- | Fidelity National Title |
Source: Public Records
Mortgage History
| Date | Status | Borrower | Loan Amount |
|---|---|---|---|
| Open | Ortega Francisco | $158,902 | |
| Previous Owner | Carrillo Fred J | $101,250 | |
| Closed | Ortega Francisco | $4,830 |
Source: Public Records
Tax History Compared to Growth
Tax History
| Year | Tax Paid | Tax Assessment Tax Assessment Total Assessment is a certain percentage of the fair market value that is determined by local assessors to be the total taxable value of land and additions on the property. | Land | Improvement |
|---|---|---|---|---|
| 2025 | $3,547 | $266,234 | $127,707 | $138,527 |
| 2024 | $3,547 | $261,014 | $125,203 | $135,811 |
| 2023 | $3,459 | $255,898 | $122,749 | $133,149 |
| 2022 | $3,362 | $250,882 | $120,343 | $130,539 |
| 2021 | $3,297 | $245,964 | $117,984 | $127,980 |
| 2020 | $3,256 | $243,443 | $116,775 | $126,668 |
| 2019 | $3,205 | $238,671 | $114,486 | $124,185 |
| 2018 | $3,079 | $233,992 | $112,242 | $121,750 |
| 2016 | $2,852 | $224,908 | $107,885 | $117,023 |
| 2015 | $2,800 | $221,531 | $106,265 | $115,266 |
| 2014 | $2,760 | $217,193 | $104,184 | $113,009 |
Source: Public Records
Map
Nearby Homes
- 357 Cadbrook Dr
- 14940 Beckner St
- 15246 Temple Ave
- 14972 Giordano St
- 15416 Giordano St
- 750 Glenshaw Dr
- 829 Foxworth Ave
- 822 Greenberry Dr
- 14612 Hutchcroft St
- 15732 Victoria Ave
- 545 N 5th St
- 736 Tonopah Ave
- 932 Shadydale Ave
- 15900 Rowland St
- 544 N Orange Ave Unit B
- 15879 Hill St
- 15625 Loukelton St
- 14510 Amar Rd Unit J
- 14421 Flynn St
- 15149 Salt Lake Ave
- 15057 Nelson Ave
- 15111 Nelson Ave
- 15050 Flagstaff St
- 15051 Nelson Ave
- 15104 Flagstaff St
- 15044 Flagstaff St
- 15110 Flagstaff St
- 15038 Flagstaff St
- 15119 Nelson Ave
- 15045 Nelson Ave
- 15116 Flagstaff St
- 15034 Flagstaff St
- 15125 Nelson Ave
- 306 Cadbrook Dr
- 15122 Flagstaff St
- 314 Cadbrook Dr
- 330 Melham Ave
- 15041 Flagstaff St
- 15109 Flagstaff St
- 15131 Nelson Ave