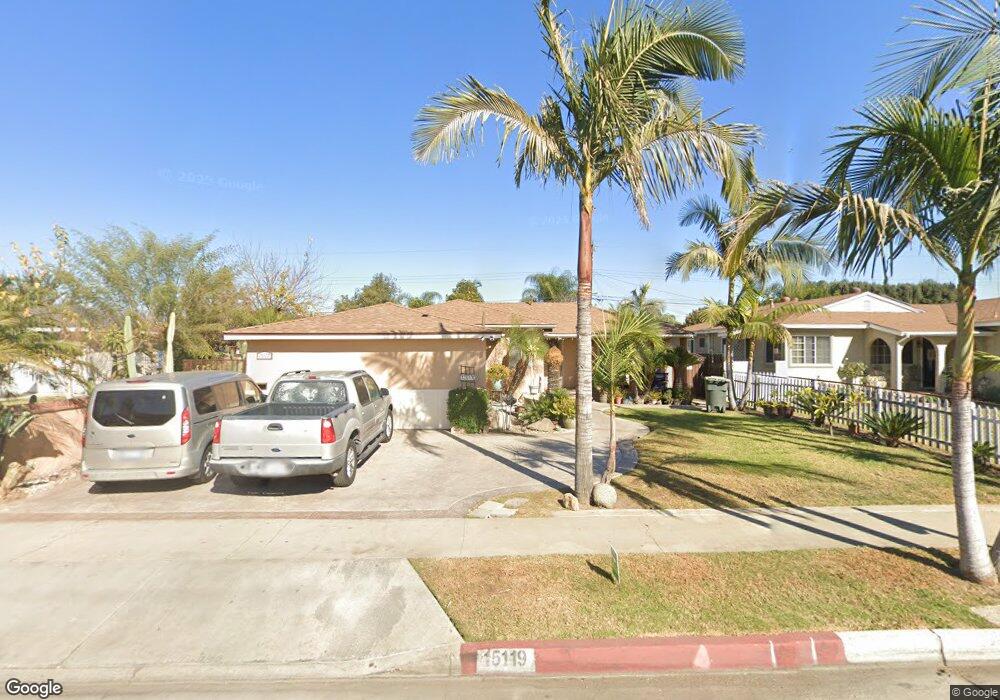
15119 Nelson Ave La Puente, CA 91744
Estimated Value: $641,216 - $697,000
3
Beds
1
Bath
1,067
Sq Ft
$639/Sq Ft
Est. Value
About This Home
This home is located at 15119 Nelson Ave, La Puente, CA 91744 and is currently estimated at $682,304, approximately $639 per square foot. 15119 Nelson Ave is a home located in Los Angeles County with nearby schools including Nelson Elementary School, Sparks Middle School, and La Puente High School.
Ownership History
Date
Name
Owned For
Owner Type
Purchase Details
Closed on
May 23, 2016
Sold by
Velasco Juana
Bought by
Velasco Juana
Current Estimated Value
Home Financials for this Owner
Home Financials are based on the most recent Mortgage that was taken out on this home.
Original Mortgage
$194,750
Outstanding Balance
$154,629
Interest Rate
3.58%
Mortgage Type
New Conventional
Estimated Equity
$527,675
Purchase Details
Closed on
Mar 8, 2003
Sold by
Arellano Maria Elena
Bought by
Velasco Juana
Purchase Details
Closed on
Nov 30, 2001
Sold by
Oshima Jose A
Bought by
Arellano Maria Elena
Purchase Details
Closed on
Mar 28, 1994
Sold by
Wilson Evelyn
Bought by
Oshima Jose A
Home Financials for this Owner
Home Financials are based on the most recent Mortgage that was taken out on this home.
Original Mortgage
$128,600
Interest Rate
6%
Mortgage Type
FHA
Create a Home Valuation Report for This Property
The Home Valuation Report is an in-depth analysis detailing your home's value as well as a comparison with similar homes in the area
Home Values in the Area
Average Home Value in this Area
Purchase History
| Date | Buyer | Sale Price | Title Company |
|---|---|---|---|
| Velasco Juana | -- | Wfg National Title Co Of Ca | |
| Velasco Juana | -- | -- | |
| Arellano Maria Elena | -- | -- | |
| Oshima Jose A | $130,000 | Fidelity National Title Ins |
Source: Public Records
Mortgage History
| Date | Status | Borrower | Loan Amount |
|---|---|---|---|
| Open | Velasco Juana | $194,750 | |
| Previous Owner | Oshima Jose A | $128,600 |
Source: Public Records
Tax History Compared to Growth
Tax History
| Year | Tax Paid | Tax Assessment Tax Assessment Total Assessment is a certain percentage of the fair market value that is determined by local assessors to be the total taxable value of land and additions on the property. | Land | Improvement |
|---|---|---|---|---|
| 2025 | $4,116 | $308,474 | $223,758 | $84,716 |
| 2024 | $4,116 | $302,426 | $219,371 | $83,055 |
| 2023 | $4,014 | $296,497 | $215,070 | $81,427 |
| 2022 | $3,868 | $290,684 | $210,853 | $79,831 |
| 2021 | $3,800 | $284,985 | $206,719 | $78,266 |
| 2019 | $3,695 | $276,535 | $200,589 | $75,946 |
| 2018 | $3,550 | $271,113 | $196,656 | $74,457 |
| 2016 | $3,297 | $260,587 | $189,020 | $71,567 |
| 2015 | $3,237 | $256,673 | $186,181 | $70,492 |
| 2014 | $3,190 | $251,646 | $182,534 | $69,112 |
Source: Public Records
Map
Nearby Homes
- 357 Cadbrook Dr
- 14940 Beckner St
- 15246 Temple Ave
- 14972 Giordano St
- 15416 Giordano St
- 750 Glenshaw Dr
- 829 Foxworth Ave
- 14612 Hutchcroft St
- 822 Greenberry Dr
- 15732 Victoria Ave
- 736 Tonopah Ave
- 545 N 5th St
- 544 N Orange Ave Unit B
- 932 Shadydale Ave
- 15900 Rowland St
- 14421 Flynn St
- 14510 Amar Rd Unit J
- 15879 Hill St
- 15625 Loukelton St
- 15149 Salt Lake Ave
- 15125 Nelson Ave
- 15111 Nelson Ave
- 15116 Flagstaff St
- 15131 Nelson Ave
- 15122 Flagstaff St
- 15110 Flagstaff St
- 15126 Flagstaff St
- 15104 Flagstaff St
- 15137 Nelson Ave
- 15103 Nelson Ave
- 15132 Flagstaff St
- 15050 Flagstaff St
- 15143 Nelson Ave
- 15057 Nelson Ave
- 15138 Flagstaff St
- 15044 Flagstaff St
- 15115 Flagstaff St
- 331 Aldgate Ave
- 15147 Nelson Ave
- 15109 Flagstaff St