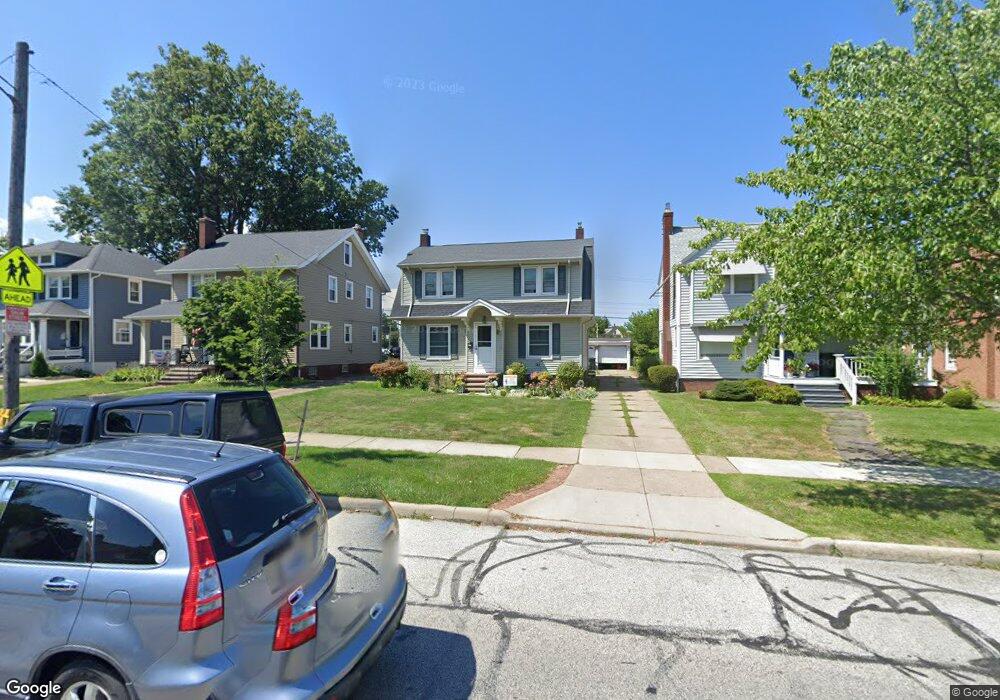
1512 Bunts Rd Lakewood, OH 44107
Estimated Value: $297,000 - $345,000
3
Beds
1
Bath
1,527
Sq Ft
$216/Sq Ft
Est. Value
About This Home
This home is located at 1512 Bunts Rd, Lakewood, OH 44107 and is currently estimated at $330,024, approximately $216 per square foot. 1512 Bunts Rd is a home located in Cuyahoga County with nearby schools including Emerson Elementary School, Garfield Middle School, and Lakewood High School.
Ownership History
Date
Name
Owned For
Owner Type
Purchase Details
Closed on
Aug 21, 1997
Sold by
See Robert W
Bought by
Hudson Karen L
Current Estimated Value
Home Financials for this Owner
Home Financials are based on the most recent Mortgage that was taken out on this home.
Original Mortgage
$89,600
Outstanding Balance
$13,454
Interest Rate
7.56%
Mortgage Type
New Conventional
Estimated Equity
$316,570
Purchase Details
Closed on
Aug 28, 1989
Sold by
Foote Jeanne M
Bought by
See Robert W
Purchase Details
Closed on
Jun 26, 1987
Sold by
Simon Declan J
Bought by
Foote Jeanne M
Purchase Details
Closed on
Mar 29, 1985
Sold by
Simon Declan J
Bought by
Simon Declan J
Purchase Details
Closed on
Jul 12, 1979
Sold by
Pickett Ronald S
Bought by
Simon Declan J
Purchase Details
Closed on
Aug 26, 1977
Sold by
Mcginty John P and Mcginty Barbara S
Bought by
Pickett Ronald S
Purchase Details
Closed on
Jan 1, 1975
Bought by
Mcginty John P and Mcginty Barbara S
Create a Home Valuation Report for This Property
The Home Valuation Report is an in-depth analysis detailing your home's value as well as a comparison with similar homes in the area
Home Values in the Area
Average Home Value in this Area
Purchase History
| Date | Buyer | Sale Price | Title Company |
|---|---|---|---|
| Hudson Karen L | $112,000 | -- | |
| See Robert W | $83,000 | -- | |
| Foote Jeanne M | $65,000 | -- | |
| Simon Declan J | -- | -- | |
| Simon Declan J | $55,500 | -- | |
| Pickett Ronald S | $47,300 | -- | |
| Mcginty John P | -- | -- |
Source: Public Records
Mortgage History
| Date | Status | Borrower | Loan Amount |
|---|---|---|---|
| Open | Hudson Karen L | $89,600 |
Source: Public Records
Tax History Compared to Growth
Tax History
| Year | Tax Paid | Tax Assessment Tax Assessment Total Assessment is a certain percentage of the fair market value that is determined by local assessors to be the total taxable value of land and additions on the property. | Land | Improvement |
|---|---|---|---|---|
| 2024 | $6,484 | $100,940 | $18,655 | $82,285 |
| 2023 | $5,643 | $75,190 | $17,610 | $57,580 |
| 2022 | $5,679 | $75,180 | $17,610 | $57,580 |
| 2021 | $5,621 | $75,180 | $17,610 | $57,580 |
| 2020 | $4,985 | $58,280 | $13,650 | $44,630 |
| 2019 | $4,886 | $166,500 | $39,000 | $127,500 |
| 2018 | $4,878 | $58,280 | $13,650 | $44,630 |
| 2017 | $4,093 | $44,420 | $10,400 | $34,020 |
| 2016 | $4,065 | $44,420 | $10,400 | $34,020 |
| 2015 | $4,066 | $44,420 | $10,400 | $34,020 |
| 2014 | $4,066 | $42,700 | $10,010 | $32,690 |
Source: Public Records
Map
Nearby Homes
- 1532 Parkwood Rd
- 1458 Wyandotte Ave
- 1576 Wyandotte Ave
- 1463 Wyandotte Ave
- 1539 Elbur Ave
- 1514 Olivewood Ave
- 13532 Elbur Ln
- 1415 Olivewood Ave Unit 17
- 1545 Marlowe Ave
- 1605 Lewis Dr
- 1503 Chesterland Ave
- 1593 Marlowe Ave
- 1675 Roosevelt Ave
- 1485 Waterbury Rd
- 1314 Chase Ave
- 1304 Bunts Rd
- 1300 Giel Ave
- 2039 Richland Ave
- 1511 Clarence Ave
- 1617 Clarence Ave