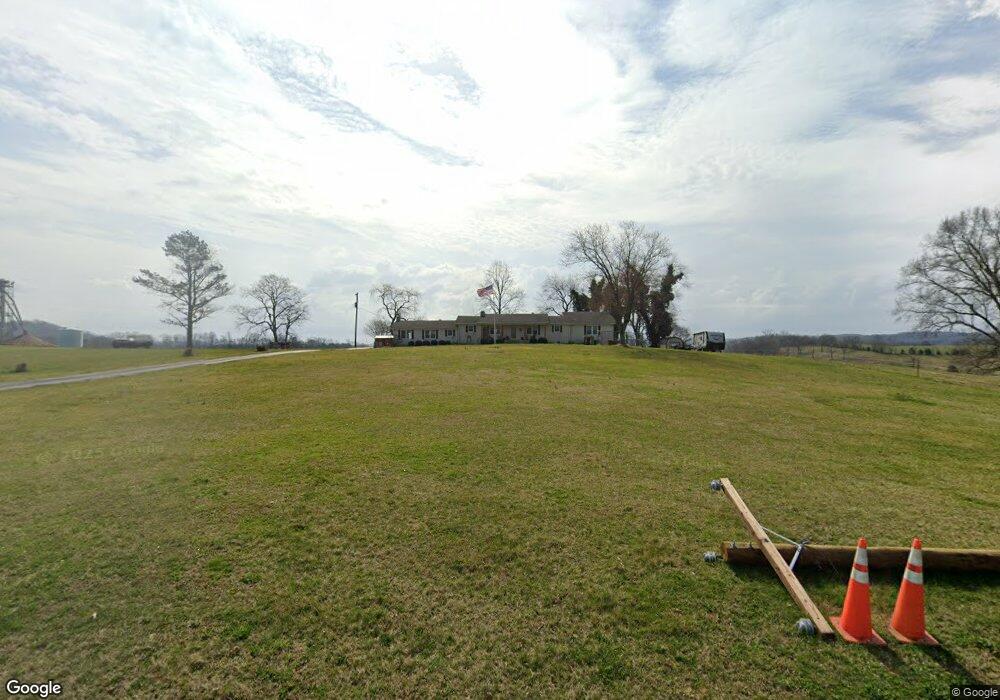
1512 Old Elkton Pike Dellrose, TN 38453
Estimated Value: $286,000 - $360,000
--
Bed
2
Baths
2,471
Sq Ft
$134/Sq Ft
Est. Value
About This Home
This home is located at 1512 Old Elkton Pike, Dellrose, TN 38453 and is currently estimated at $331,483, approximately $134 per square foot. 1512 Old Elkton Pike is a home located in Lincoln County with nearby schools including Lincoln Central Academy, Unity School, and Lincoln County High School.
Ownership History
Date
Name
Owned For
Owner Type
Purchase Details
Closed on
Sep 18, 2014
Sold by
Bryan John S
Bought by
Masiello John and Masiello Tina L
Current Estimated Value
Home Financials for this Owner
Home Financials are based on the most recent Mortgage that was taken out on this home.
Original Mortgage
$144,001
Outstanding Balance
$110,283
Interest Rate
4.15%
Mortgage Type
VA
Estimated Equity
$221,200
Purchase Details
Closed on
Sep 10, 2014
Sold by
Giles Alma Cash
Bought by
Holt Claude and Holt Betty Gail
Home Financials for this Owner
Home Financials are based on the most recent Mortgage that was taken out on this home.
Original Mortgage
$144,001
Outstanding Balance
$110,283
Interest Rate
4.15%
Mortgage Type
VA
Estimated Equity
$221,200
Purchase Details
Closed on
Dec 18, 2013
Sold by
Bryan John S
Bought by
Bryan John S and Bryan Dana C
Purchase Details
Closed on
Jul 12, 2013
Sold by
Martin Barbara
Bought by
First National Bank Of Pulaski
Create a Home Valuation Report for This Property
The Home Valuation Report is an in-depth analysis detailing your home's value as well as a comparison with similar homes in the area
Home Values in the Area
Average Home Value in this Area
Purchase History
| Date | Buyer | Sale Price | Title Company |
|---|---|---|---|
| Masiello John | $144,001 | -- | |
| Masiello John | $144,001 | -- | |
| Holt Claude | $45,000 | -- | |
| Holt Claude | $45,000 | -- | |
| Bryan John S | $500 | -- | |
| Bryan John S | $500 | -- | |
| First National Bank Of Pulaski | $42,532 | -- | |
| First National Bank Of Pulaski | $42,532 | -- |
Source: Public Records
Mortgage History
| Date | Status | Borrower | Loan Amount |
|---|---|---|---|
| Open | Masiello John | $144,001 | |
| Closed | Masiello John | $144,001 |
Source: Public Records
Tax History Compared to Growth
Tax History
| Year | Tax Paid | Tax Assessment Tax Assessment Total Assessment is a certain percentage of the fair market value that is determined by local assessors to be the total taxable value of land and additions on the property. | Land | Improvement |
|---|---|---|---|---|
| 2024 | $1,500 | $78,975 | $8,150 | $70,825 |
| 2023 | $1,401 | $48,625 | $3,375 | $45,250 |
| 2022 | $1,022 | $48,625 | $3,375 | $45,250 |
| 2021 | $1,022 | $48,625 | $3,375 | $45,250 |
| 2020 | $1,022 | $48,625 | $3,375 | $45,250 |
| 2019 | $1,022 | $48,625 | $3,375 | $45,250 |
| 2018 | $828 | $33,375 | $3,375 | $30,000 |
| 2017 | $781 | $33,375 | $3,375 | $30,000 |
| 2016 | $781 | $33,375 | $3,375 | $30,000 |
| 2015 | -- | $33,375 | $3,375 | $30,000 |
| 2014 | $647 | $33,025 | $3,375 | $29,650 |
Source: Public Records
Map
Nearby Homes
- 0 McBurg Dellrose Rd Tract 1
- 0 McBurg Dellrose Rd Tract 2
- 0 McBurg Dellrose Rd Tract 3
- 0 McBurg Dellrose Rd Unit LotWP001 24895992
- 0 McBurg Dellrose Rd Unit LotWP001 24895993
- 0 McBurg Dellrose Rd Unit LotWP001
- 1143 Old Elkton Pike
- 6 Short Creek Rd
- 468 Adams Rd
- 6956 Bunker Hill Rd
- 12 Savannah Rd
- 305 Ingram Rd
- 477 Lake Logan Rd
- 195 Curtis Rd
- 195 Curtis Dr
- 852 Lake Logan Rd
- 0 Robinson Rd
- 35 Cheatham Rd
- 239 Henry Bayless Rd
- 9 Old Stage Rd
- 1503 Old Elkton Pike
- 1502 Old Elkton Pike
- 1529 Old Elkton Pike
- 1528 Old Elkton Pike
- 1499 Old Elkton Pike
- 1497 Old Elkton Pike
- 11 Front St
- 1490 Old Elkton Pike
- 1489 Old Elkton Pike
- 1483 Old Elkton Pike
- 1523 Old Elkton Pike
- 3 Curtis Church Rd
- 1555 Old Elkton Pike
- 1558 Old Elkton Pike
- 1451 Old Elkton Pike
- 539 McBurg Dellrose Rd
- 543 McBurg Dellrose Rd
- 1446 Old Elkton Pike
- 1595 Old Elkton Pike
- 1571 Elkton Pike