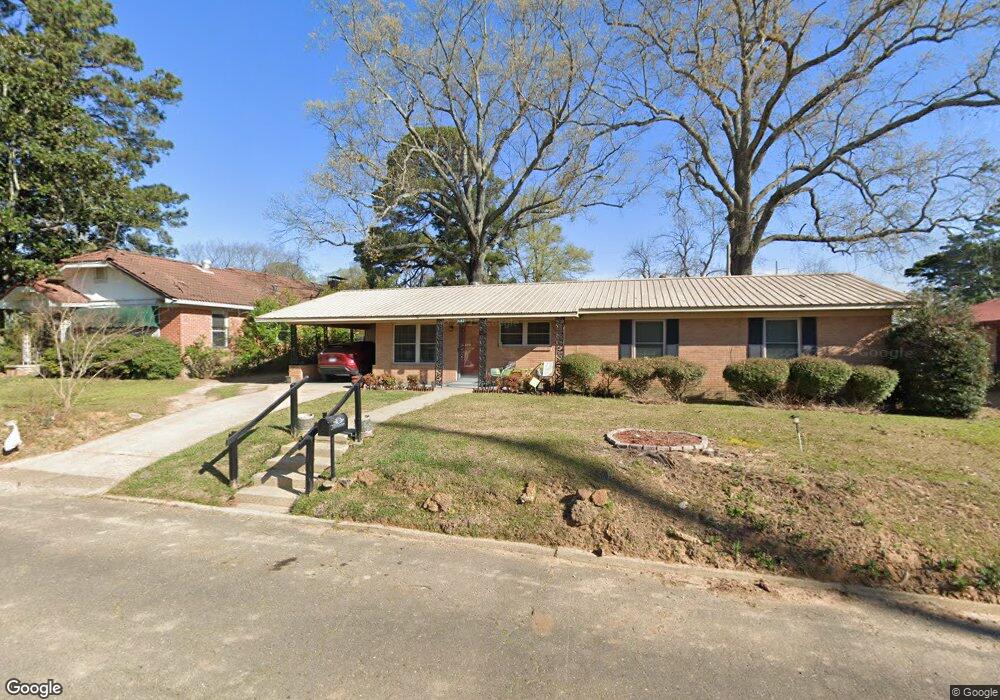
1512 W 11th St Texarkana, TX 75501
Estimated Value: $80,000 - $102,671
--
Bed
--
Bath
1,735
Sq Ft
$53/Sq Ft
Est. Value
About This Home
This home is located at 1512 W 11th St, Texarkana, TX 75501 and is currently estimated at $92,418, approximately $53 per square foot. 1512 W 11th St is a home located in Bowie County with nearby schools including Theron Jones Early Literacy Center, Westlawn Elementary School, and Texas Middle School.
Ownership History
Date
Name
Owned For
Owner Type
Purchase Details
Closed on
May 23, 2017
Sold by
Graham Kenneth and Graham Kenneth Calvin
Bought by
Graham Sammie and Graham Sammie Louise
Current Estimated Value
Home Financials for this Owner
Home Financials are based on the most recent Mortgage that was taken out on this home.
Original Mortgage
$65,915
Outstanding Balance
$44,803
Interest Rate
4.12%
Mortgage Type
FHA
Estimated Equity
$47,615
Purchase Details
Closed on
May 22, 2006
Sold by
Graham Kenneth
Bought by
Graham Sammie
Home Financials for this Owner
Home Financials are based on the most recent Mortgage that was taken out on this home.
Original Mortgage
$65,000
Interest Rate
10.45%
Mortgage Type
Adjustable Rate Mortgage/ARM
Create a Home Valuation Report for This Property
The Home Valuation Report is an in-depth analysis detailing your home's value as well as a comparison with similar homes in the area
Home Values in the Area
Average Home Value in this Area
Purchase History
| Date | Buyer | Sale Price | Title Company |
|---|---|---|---|
| Graham Sammie | -- | Title Source Inc | |
| Graham Sammie | -- | None Available | |
| Graham Sammie | -- | None Available |
Source: Public Records
Mortgage History
| Date | Status | Borrower | Loan Amount |
|---|---|---|---|
| Open | Graham Sammie | $65,915 | |
| Previous Owner | Graham Sammie | $65,000 |
Source: Public Records
Tax History Compared to Growth
Tax History
| Year | Tax Paid | Tax Assessment Tax Assessment Total Assessment is a certain percentage of the fair market value that is determined by local assessors to be the total taxable value of land and additions on the property. | Land | Improvement |
|---|---|---|---|---|
| 2025 | $869 | $85,417 | $1,500 | $83,917 |
| 2024 | $869 | $80,600 | $1,500 | $81,553 |
| 2023 | $789 | $73,273 | $0 | $0 |
| 2022 | $1,590 | $73,964 | $1,500 | $72,464 |
| 2021 | $1,548 | $60,556 | $1,500 | $59,056 |
| 2020 | $1,486 | $57,823 | $1,500 | $56,323 |
| 2019 | $1,473 | $55,222 | $1,500 | $53,722 |
| 2018 | $1,420 | $53,228 | $1,500 | $51,728 |
| 2017 | $1,390 | $52,248 | $1,500 | $50,748 |
| 2016 | $1,390 | $52,248 | $1,500 | $50,748 |
| 2015 | $1,175 | $51,767 | $1,500 | $50,267 |
| 2014 | $1,175 | $55,217 | $1,500 | $53,717 |
Source: Public Records
Map
Nearby Homes