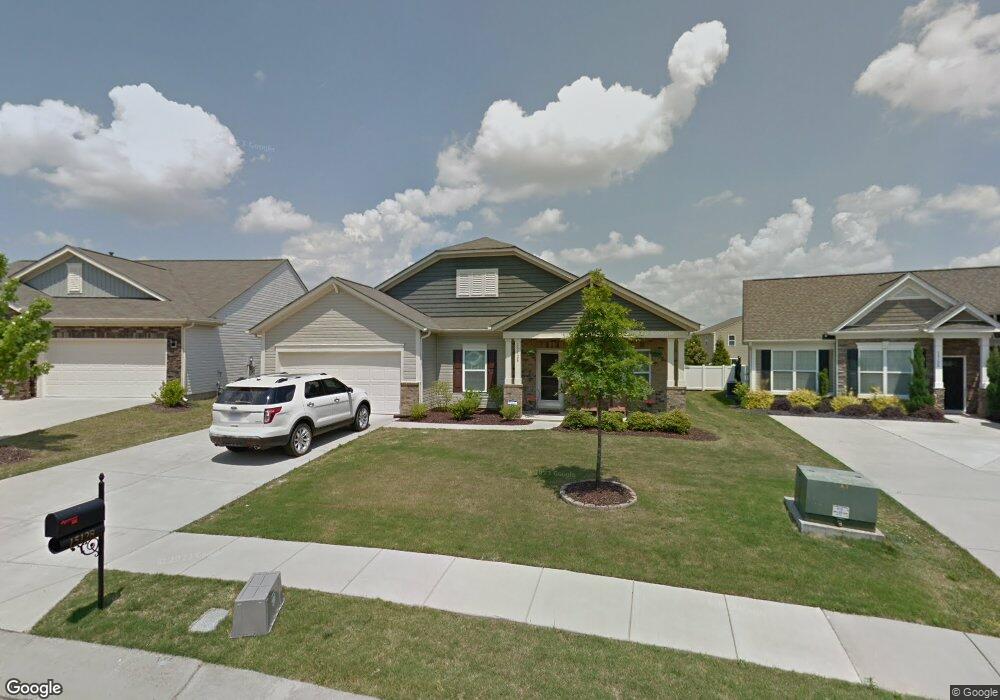
15128 Cavanshire Trail Charlotte, NC 28278
The Palisades NeighborhoodEstimated Value: $444,000 - $479,000
4
Beds
2
Baths
2,195
Sq Ft
$209/Sq Ft
Est. Value
About This Home
This home is located at 15128 Cavanshire Trail, Charlotte, NC 28278 and is currently estimated at $458,361, approximately $208 per square foot. 15128 Cavanshire Trail is a home located in Mecklenburg County with nearby schools including River Gate Elementary, Southwest Middle School, and Unity Classical Charter School.
Ownership History
Date
Name
Owned For
Owner Type
Purchase Details
Closed on
Jul 29, 2019
Sold by
Echevarria Julie Rose and Echevarria George
Bought by
Echevarria Julie Rose and Echevarria George
Current Estimated Value
Home Financials for this Owner
Home Financials are based on the most recent Mortgage that was taken out on this home.
Original Mortgage
$239,570
Outstanding Balance
$210,034
Interest Rate
3.75%
Mortgage Type
FHA
Estimated Equity
$248,327
Purchase Details
Closed on
Sep 26, 2012
Sold by
M I Homes Of Charlotte Llc
Bought by
Hasson Julie Rose
Home Financials for this Owner
Home Financials are based on the most recent Mortgage that was taken out on this home.
Original Mortgage
$178,354
Interest Rate
3.25%
Mortgage Type
FHA
Purchase Details
Closed on
May 17, 2010
Sold by
Fifth Third Bank
Bought by
M/I Homes Of Charlotte Llc
Purchase Details
Closed on
Jan 8, 2010
Sold by
Creekshire Development Llc
Bought by
Fifth Third Bank
Create a Home Valuation Report for This Property
The Home Valuation Report is an in-depth analysis detailing your home's value as well as a comparison with similar homes in the area
Home Values in the Area
Average Home Value in this Area
Purchase History
| Date | Buyer | Sale Price | Title Company |
|---|---|---|---|
| Echevarria Julie Rose | -- | None Available | |
| Hasson Julie Rose | $173,000 | None Available | |
| M/I Homes Of Charlotte Llc | $4,600,000 | None Available | |
| Fifth Third Bank | $4,518,000 | None Available |
Source: Public Records
Mortgage History
| Date | Status | Borrower | Loan Amount |
|---|---|---|---|
| Open | Echevarria Julie Rose | $239,570 | |
| Closed | Hasson Julie Rose | $178,354 |
Source: Public Records
Tax History Compared to Growth
Tax History
| Year | Tax Paid | Tax Assessment Tax Assessment Total Assessment is a certain percentage of the fair market value that is determined by local assessors to be the total taxable value of land and additions on the property. | Land | Improvement |
|---|---|---|---|---|
| 2025 | $2,888 | $412,700 | $90,000 | $322,700 |
| 2024 | $2,888 | $412,700 | $90,000 | $322,700 |
| 2023 | $2,888 | $412,400 | $90,000 | $322,400 |
| 2022 | $2,467 | $270,800 | $40,000 | $230,800 |
| 2021 | $2,409 | $270,800 | $40,000 | $230,800 |
| 2020 | $2,395 | $270,800 | $40,000 | $230,800 |
| 2019 | $2,367 | $270,800 | $40,000 | $230,800 |
| 2018 | $1,905 | $168,000 | $38,300 | $129,700 |
| 2017 | $1,889 | $168,000 | $38,300 | $129,700 |
| 2016 | $1,864 | $168,000 | $38,300 | $129,700 |
| 2015 | $1,843 | $168,000 | $38,300 | $129,700 |
| 2014 | $1,812 | $168,000 | $38,300 | $129,700 |
Source: Public Records
Map
Nearby Homes
- 13309 Zoar Rd
- 15030 Brannock Hills Dr
- 14706 Metaghan Ct
- 14909 Brannock Hills Dr
- 12809 Hunting Birds Ln
- 1385 Rainier Dr
- 14727 Brannock Hills Dr
- 660 Brookhaven Dr
- 1326 Crown Ridge Dr
- 1212 Croft Dr
- 15307 Autumn Sage Dr
- 4069 Havenport Cir
- 1700 Zoar Rd
- 15133 Torrence Branch Rd
- 3260 Highway 160 W
- 16001 Arabian Mews Ln
- 16035 Long Talon Way
- 15700 Youngblood Rd
- 16102 Long Talon Way
- 16036 Arabian Mews Ln
- 15132 Cavanshire Trail
- 15124 Cavanshire Trail
- 13317 Shanagarry Dr
- 13321 Shanagarry Dr
- 13313 Shanagarry Dr
- 15125 Cavanshire Trail
- 15116 Cavanshire Trail
- 15116 Cavanshire Trail Unit 248
- 15131 Cavanshire Trail
- 13032 Hunting Birds Ln
- 13028 Hunting Birds Ln
- 14310 Lunenberg Ln
- 15117 Cavanshire Trail
- 13036 Hunting Birds Ln
- 13024 Hunting Birds Ln
- 14314 Lunenberg Ln
- 14314 Lunenberg Ln Unit 244
- 13104 Hunting Birds Ln
- 13020 Hunting Birds Ln
- 14306 Lunenberg Ln