Estimated Value: $391,000 - $432,000
3
Beds
3
Baths
1,462
Sq Ft
$279/Sq Ft
Est. Value
About This Home
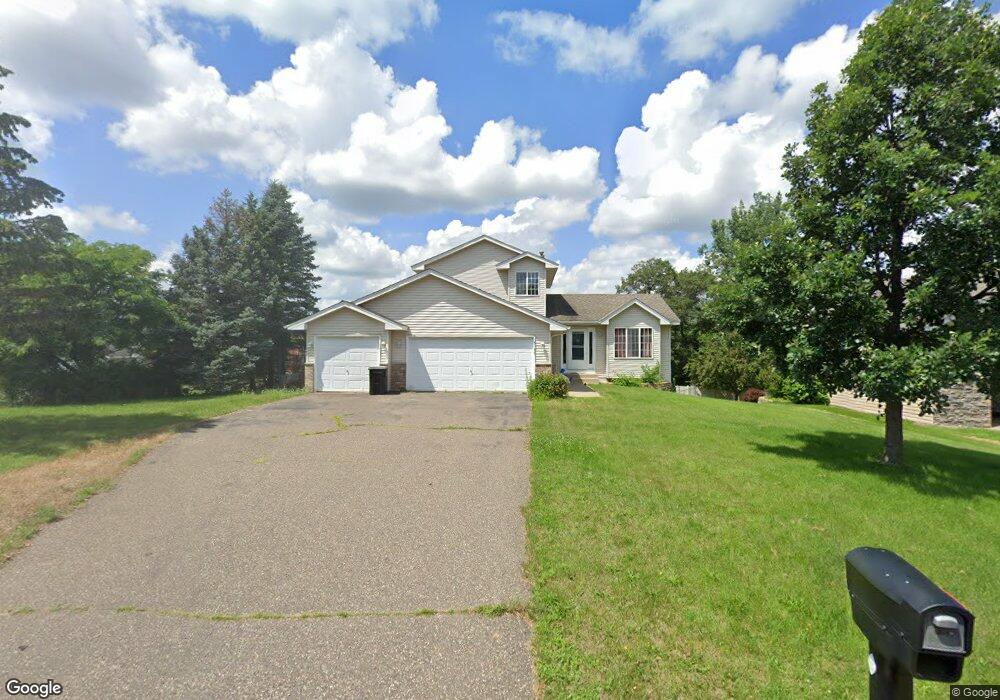
This home is located at 15160 Quicksilver St, Anoka, MN 55303 and is currently estimated at $407,551, approximately $278 per square foot. 15160 Quicksilver St is a home located in Anoka County with nearby schools including Ramsey Elementary School, Anoka Middle School for the Arts - Fred Moor Campus, and Anoka Senior High School.
Ownership History
Date
Name
Owned For
Owner Type
Purchase Details
Closed on
Apr 27, 2023
Sold by
Olson Byron and Olson Renee
Bought by
Schulte Logan and Schulte Jade
Current Estimated Value
Home Financials for this Owner
Home Financials are based on the most recent Mortgage that was taken out on this home.
Original Mortgage
$280,000
Outstanding Balance
$272,508
Interest Rate
6.6%
Mortgage Type
New Conventional
Estimated Equity
$135,043
Purchase Details
Closed on
Jan 29, 2013
Sold by
Schuett Jessica L and Schuett Wayne K
Bought by
Jacob Gregory R
Purchase Details
Closed on
Nov 15, 2011
Sold by
Chapman Chad W and Chapman Alicia
Bought by
Sandwick Renee
Purchase Details
Closed on
Sep 30, 1997
Sold by
Shade Tree Construction Inc
Bought by
Chapman Chad W and Chapman Rachael R
Purchase Details
Closed on
Jul 7, 1997
Sold by
Residential Development Inc
Bought by
Shade Tree Construction Inc
Create a Home Valuation Report for This Property
The Home Valuation Report is an in-depth analysis detailing your home's value as well as a comparison with similar homes in the area
Home Values in the Area
Average Home Value in this Area
Purchase History
| Date | Buyer | Sale Price | Title Company |
|---|---|---|---|
| Schulte Logan | $350,000 | -- | |
| Jacob Gregory R | -- | None Available | |
| Sandwick Renee | $145,000 | -- | |
| Chapman Chad W | $120,000 | -- | |
| Shade Tree Construction Inc | $29,500 | -- |
Source: Public Records
Mortgage History
| Date | Status | Borrower | Loan Amount |
|---|---|---|---|
| Open | Schulte Logan | $280,000 |
Source: Public Records
Tax History Compared to Growth
Tax History
| Year | Tax Paid | Tax Assessment Tax Assessment Total Assessment is a certain percentage of the fair market value that is determined by local assessors to be the total taxable value of land and additions on the property. | Land | Improvement |
|---|---|---|---|---|
| 2025 | $4,017 | $369,000 | $96,800 | $272,200 |
| 2024 | $4,017 | $363,900 | $90,100 | $273,800 |
| 2023 | $3,618 | $362,400 | $85,800 | $276,600 |
| 2022 | $3,237 | $352,300 | $71,700 | $280,600 |
| 2021 | $3,066 | $288,500 | $59,400 | $229,100 |
| 2020 | $3,207 | $274,700 | $56,100 | $218,600 |
| 2019 | $3,072 | $277,800 | $56,100 | $221,700 |
| 2018 | $3,028 | $260,200 | $0 | $0 |
| 2017 | $2,768 | $248,900 | $0 | $0 |
| 2016 | $2,738 | $221,400 | $0 | $0 |
| 2015 | -- | $221,400 | $49,000 | $172,400 |
| 2014 | -- | $189,100 | $38,000 | $151,100 |
Source: Public Records
Map
Nearby Homes
- 15160 Quicksilver St NW
- 5907 151st Ln NW
- 5845 151st Ln NW
- 5817 151st Ln NW
- 5901 151st Ln NW
- 5831 151st Ln NW
- 5803 151st Ln NW
- 15363 Radium St NW
- 5641 149th Ln NW
- 5696 154th Cove NW
- 14683 Sodium St NW
- 14795 Krypton Ct NW
- 6007 146th Ave NW
- 14573 Krypton St NW
- 15800 Nowthen Blvd NW
- 6295 144th Ave NW
- 14660 Cobalt St NW Unit 12
- 14701 Cobalt St NW Unit 47
- 14661 Cobalt St NW Unit 43
- 5431 145th Ave NW
- 15170 Quicksilver St
- 6071 151st Ln NW
- 15180 Quicksilver St
- 15161 Quicksilver St
- 15161 Quicksilver St NW
- 6081 151st Ln NW
- 6040 151st Ln NW
- 15171 Quicksilver St
- 6060 151st Ln NW
- 15171 Quicksilver St NW
- 6020 151st Ln NW
- 6080 151st Ln NW
- 15181 Quicksilver St
- 15200 Quicksilver St NW
- 15200 Quicksilver St
- 15181 Quicksilver St NW
- 6000 151st Ln NW
- 6090 151st Ln NW
- 15201 Quicksilver St
- 15201 Quicksilver St NW