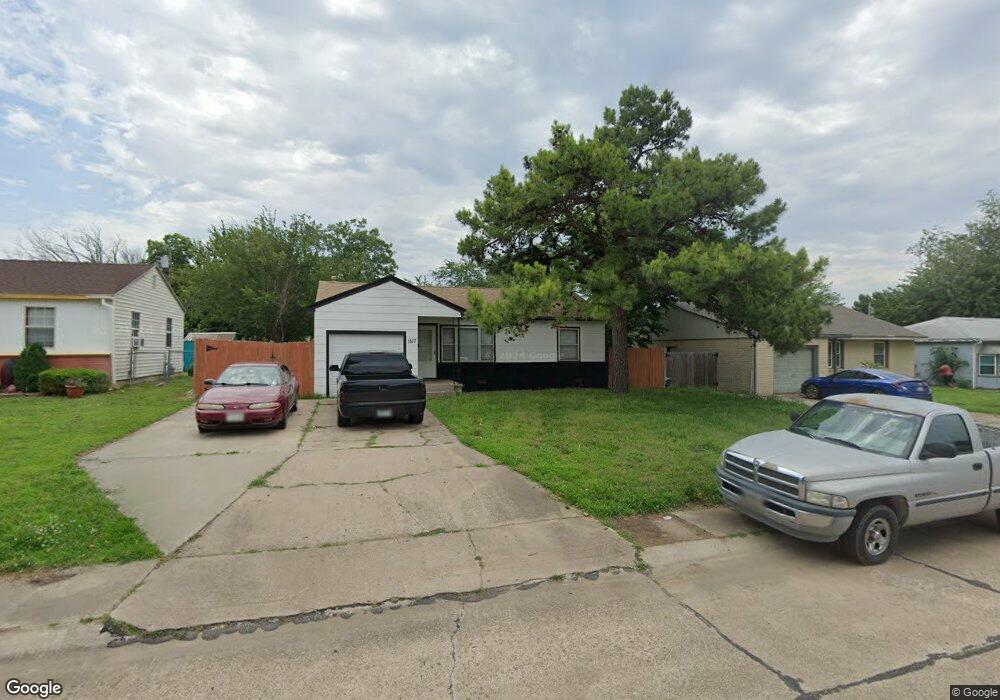
1517 N Osage St Ponca City, OK 74601
Estimated Value: $78,000 - $105,000
2
Beds
1
Bath
831
Sq Ft
$109/Sq Ft
Est. Value
About This Home
This home is located at 1517 N Osage St, Ponca City, OK 74601 and is currently estimated at $90,449, approximately $108 per square foot. 1517 N Osage St is a home located in Kay County with nearby schools including Liberty Elementary School, Ponca City West Middle School, and Ponca City East Middle School.
Ownership History
Date
Name
Owned For
Owner Type
Purchase Details
Closed on
Nov 20, 2024
Sold by
Caballero Belen and Caballero Jovan
Bought by
Caballero Jose and Caballero Carmen
Current Estimated Value
Home Financials for this Owner
Home Financials are based on the most recent Mortgage that was taken out on this home.
Original Mortgage
$89,001
Outstanding Balance
$88,183
Interest Rate
6.54%
Mortgage Type
New Conventional
Estimated Equity
$2,266
Purchase Details
Closed on
Nov 25, 2020
Sold by
Tayrien Pamela R and Tayrien Freddie Joe
Bought by
Caballero Jovan Gonzalez and Caballero Belen Maria
Home Financials for this Owner
Home Financials are based on the most recent Mortgage that was taken out on this home.
Original Mortgage
$85,000
Interest Rate
2.8%
Mortgage Type
New Conventional
Purchase Details
Closed on
Aug 29, 2003
Sold by
Cynthia Anthony and Cynthia Burgess
Bought by
Pamela Wm and Pamela Palmer
Purchase Details
Closed on
Dec 31, 1993
Sold by
Freddy Freddy V and Freddy Stolhand M
Bought by
Anthony Anthony D and Anthony Burgess C
Create a Home Valuation Report for This Property
The Home Valuation Report is an in-depth analysis detailing your home's value as well as a comparison with similar homes in the area
Home Values in the Area
Average Home Value in this Area
Purchase History
| Date | Buyer | Sale Price | Title Company |
|---|---|---|---|
| Caballero Jose | $82,700 | None Listed On Document | |
| Caballero Jovan Gonzalez | $100,000 | Security Title Service | |
| Pamela Wm | $30,000 | -- | |
| Anthony Anthony D | $25,000 | -- |
Source: Public Records
Mortgage History
| Date | Status | Borrower | Loan Amount |
|---|---|---|---|
| Open | Caballero Jose | $89,001 | |
| Previous Owner | Caballero Jovan Gonzalez | $85,000 |
Source: Public Records
Tax History Compared to Growth
Tax History
| Year | Tax Paid | Tax Assessment Tax Assessment Total Assessment is a certain percentage of the fair market value that is determined by local assessors to be the total taxable value of land and additions on the property. | Land | Improvement |
|---|---|---|---|---|
| 2024 | $462 | $4,876 | $634 | $4,242 |
| 2023 | $462 | $4,644 | $634 | $4,010 |
| 2022 | $421 | $4,423 | $634 | $3,789 |
| 2021 | $423 | $4,423 | $634 | $3,789 |
| 2020 | $418 | $4,411 | $634 | $3,777 |
| 2019 | $401 | $4,201 | $634 | $3,567 |
| 2018 | $406 | $4,192 | $634 | $3,558 |
| 2017 | $411 | $4,192 | $634 | $3,558 |
| 2016 | $415 | $4,192 | $634 | $3,558 |
| 2015 | $410 | $4,121 | $634 | $3,487 |
| 2014 | $394 | $4,039 | $634 | $3,405 |
Source: Public Records
Map
Nearby Homes
- 1708 Potomac Dr
- 1217 N Pine St
- 113 E Fresno Ave
- 1016 N Oak St
- 1021 Riviera Dr
- 304 E Detroit Ave
- 1008 N 1st St
- 941 N Ash St
- 0000 N Union St
- 2005 N 4th St
- 2000 N 5th St
- 505 N Pine St
- 745 N Lake St
- 726 N Lake St
- 1412 Donahoe Dr
- 734 N 2nd St
- 1013 N 7th St
- 1035 N Sunset St
- 508 N Birch St
- 121 Hillside Ave
- 1601 N Osage St
- 1513 N Osage St
- 1509 N Osage St
- 1605 N Osage St
- 1516 Riggs Dr
- 1600 Riggs Dr
- 1512 Riggs Dr
- 1604 Riggs Dr
- 1609 N Osage St
- 1505 N Osage St
- 1516 N Osage St
- 1508 Riggs Dr
- 1600 N Osage St
- 1512 N Osage St
- 1608 Riggs Dr
- 1604 N Osage St
- 1508 N Osage St
- 1504 Riggs Dr
- 1613 N Osage St
- 1501 N Osage St