1520 Summerset Place Herndon, VA 20170
Estimated Value: $830,054 - $870,000
5
Beds
4
Baths
2,282
Sq Ft
$373/Sq Ft
Est. Value
About This Home
This home is located at 1520 Summerset Place, Herndon, VA 20170 and is currently estimated at $851,014, approximately $372 per square foot. 1520 Summerset Place is a home located in Fairfax County with nearby schools including Hutchison Elementary, Herndon Middle School, and Herndon High School.
Ownership History
Date
Name
Owned For
Owner Type
Purchase Details
Closed on
May 7, 2004
Sold by
Boorom Michael G
Bought by
Gnanasundram Bharathan
Current Estimated Value
Home Financials for this Owner
Home Financials are based on the most recent Mortgage that was taken out on this home.
Original Mortgage
$388,000
Outstanding Balance
$180,508
Interest Rate
5.39%
Mortgage Type
New Conventional
Estimated Equity
$670,506
Purchase Details
Closed on
Jun 22, 2001
Sold by
Brinklow Pamala L
Bought by
Boorom Michael G
Home Financials for this Owner
Home Financials are based on the most recent Mortgage that was taken out on this home.
Original Mortgage
$275,000
Interest Rate
7.09%
Mortgage Type
Purchase Money Mortgage
Purchase Details
Closed on
Oct 4, 1995
Sold by
Richmond American Homes Of Va
Bought by
Brinklow Todd C
Home Financials for this Owner
Home Financials are based on the most recent Mortgage that was taken out on this home.
Original Mortgage
$209,850
Interest Rate
7.86%
Create a Home Valuation Report for This Property
The Home Valuation Report is an in-depth analysis detailing your home's value as well as a comparison with similar homes in the area
Home Values in the Area
Average Home Value in this Area
Purchase History
| Date | Buyer | Sale Price | Title Company |
|---|---|---|---|
| Gnanasundram Bharathan | $485,000 | -- | |
| Boorom Michael G | $365,000 | -- | |
| Brinklow Todd C | $220,735 | -- |
Source: Public Records
Mortgage History
| Date | Status | Borrower | Loan Amount |
|---|---|---|---|
| Open | Gnanasundram Bharathan | $388,000 | |
| Previous Owner | Boorom Michael G | $275,000 | |
| Previous Owner | Brinklow Todd C | $209,850 |
Source: Public Records
Tax History Compared to Growth
Tax History
| Year | Tax Paid | Tax Assessment Tax Assessment Total Assessment is a certain percentage of the fair market value that is determined by local assessors to be the total taxable value of land and additions on the property. | Land | Improvement |
|---|---|---|---|---|
| 2025 | $9,861 | $747,720 | $250,000 | $497,720 |
| 2024 | $9,861 | $695,160 | $250,000 | $445,160 |
| 2023 | $9,586 | $690,360 | $250,000 | $440,360 |
| 2022 | $9,217 | $654,390 | $235,000 | $419,390 |
| 2021 | $6,803 | $579,760 | $195,000 | $384,760 |
| 2020 | $6,550 | $553,440 | $187,000 | $366,440 |
| 2019 | $6,550 | $553,440 | $187,000 | $366,440 |
| 2018 | $6,284 | $546,440 | $180,000 | $366,440 |
| 2017 | $6,162 | $530,770 | $175,000 | $355,770 |
| 2016 | $6,010 | $518,790 | $170,000 | $348,790 |
| 2015 | $5,658 | $506,950 | $165,000 | $341,950 |
| 2014 | $5,477 | $491,860 | $165,000 | $326,860 |
Source: Public Records
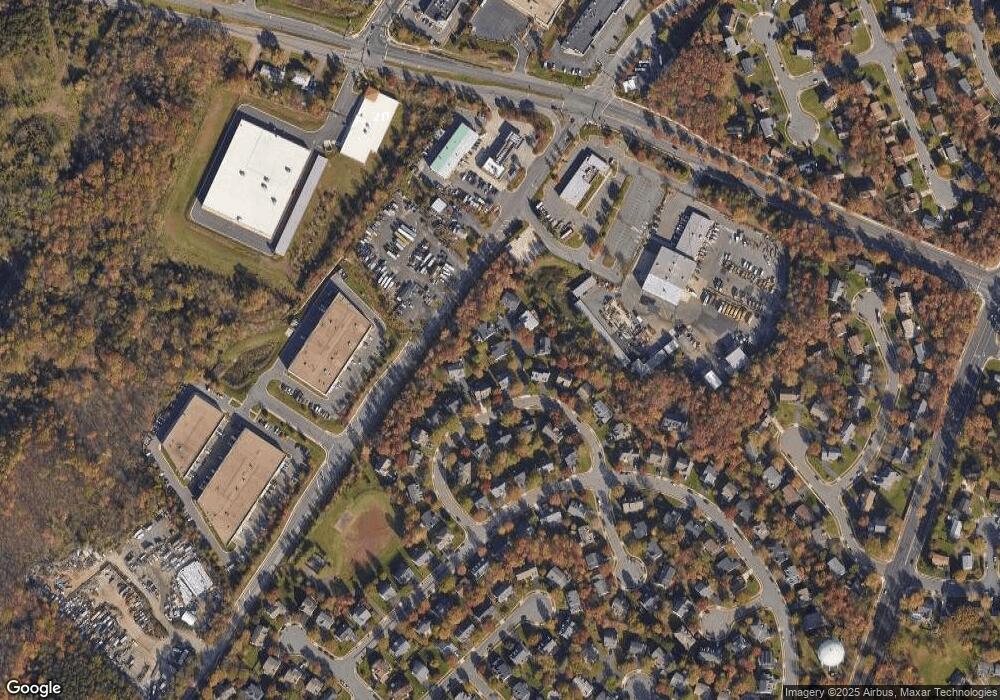
Map
Nearby Homes
- 45909 Old ox Rd
- 23032 Potomac Hill Square
- 22976 Fontwell Square
- 23017 Potomac Hill Square
- 23004 Fontwell Square Unit 508
- 1257 Magnolia Ln
- 22977 Fleet Terrace
- 22973 Whitehall Terrace
- 1213 Terrylynn Ct
- 1232 Wilshire Dr
- 22855 Chestnut Oak Terrace
- 2115 Monaghan Dr
- 2152 Rock Hill Rd
- 1127 Shannon Place
- 1160 Lisa Ct
- 13345 Feldman Place
- 13333 Feldman Place
- 2201 Chamblee Place
- 13366 Hungerford Place
- 2117 Acadia Rd
- 1522 Summerset Place
- 1514 Summerset Place
- 1524 Summerset Place
- 1510 Summerset Place
- 1512 Summerset Place
- 1526 Summerset Place
- 1516 Summerset Place
- 1528 Summerset Place
- 1508 Summerset Place
- 1509 Summerset Place
- 1511 Summerset Place
- 1530 Summerset Place
- 1513 Summerset Place
- 1532 Summerset Place
- 1504 Summerset Place
- 902 Spring Knoll Dr
- 904 Spring Knoll Dr
- 1505 Summerset Place
- 1515 Summerset Place
- 900 Spring Knoll Dr