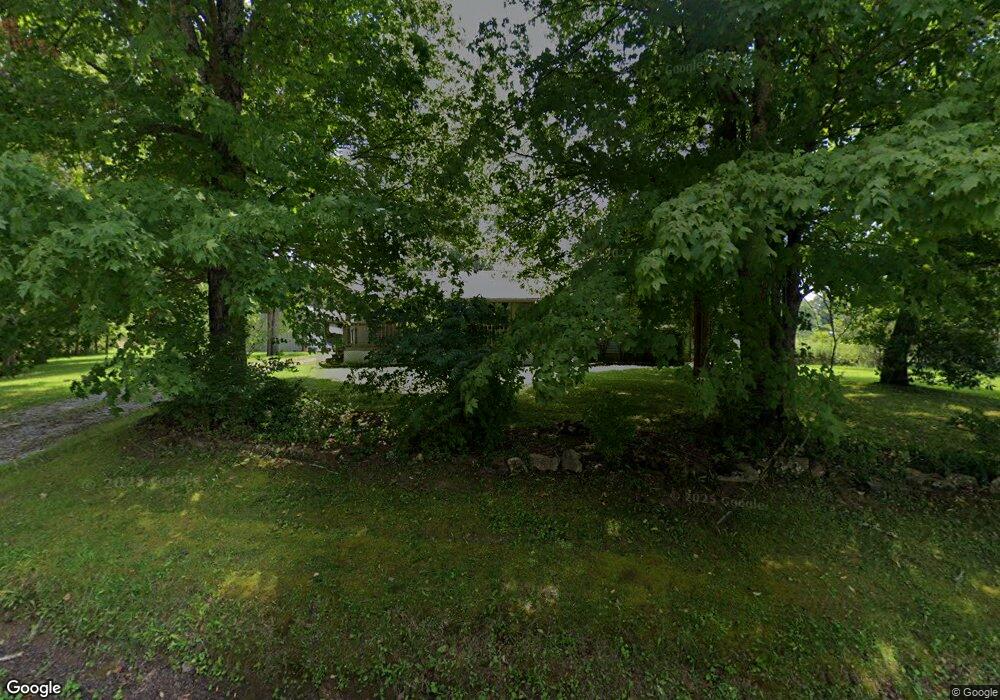
1521 Claysville Rd Crossville, TN 38571
Estimated Value: $228,000 - $407,000
3
Beds
2
Baths
1,575
Sq Ft
$204/Sq Ft
Est. Value
About This Home
This home is located at 1521 Claysville Rd, Crossville, TN 38571 and is currently estimated at $321,616, approximately $204 per square foot. 1521 Claysville Rd is a home located in Cumberland County with nearby schools including Pleasant Hill Elementary School and Cumberland County High School.
Ownership History
Date
Name
Owned For
Owner Type
Purchase Details
Closed on
Sep 28, 2017
Sold by
Miller Joel Jara
Bought by
Farmosa Kirk R
Current Estimated Value
Home Financials for this Owner
Home Financials are based on the most recent Mortgage that was taken out on this home.
Original Mortgage
$117,171
Outstanding Balance
$97,871
Interest Rate
3.82%
Mortgage Type
New Conventional
Estimated Equity
$223,745
Purchase Details
Closed on
Dec 1, 2010
Sold by
Troyer Jesse
Bought by
Jara Joel
Home Financials for this Owner
Home Financials are based on the most recent Mortgage that was taken out on this home.
Original Mortgage
$100,000
Interest Rate
4.32%
Purchase Details
Closed on
Nov 30, 2005
Sold by
Tanner Thomas L
Bought by
Troyer Jesse
Purchase Details
Closed on
Oct 22, 2001
Sold by
Holsapple Clay R and Holsapple Deborah
Bought by
Tanner Thomas L
Create a Home Valuation Report for This Property
The Home Valuation Report is an in-depth analysis detailing your home's value as well as a comparison with similar homes in the area
Home Values in the Area
Average Home Value in this Area
Purchase History
| Date | Buyer | Sale Price | Title Company |
|---|---|---|---|
| Farmosa Kirk R | $116,000 | None Available | |
| Jara Joel | $110,000 | -- | |
| Troyer Jesse | $80,000 | -- | |
| Tanner Thomas L | $84,500 | -- |
Source: Public Records
Mortgage History
| Date | Status | Borrower | Loan Amount |
|---|---|---|---|
| Open | Farmosa Kirk R | $117,171 | |
| Previous Owner | Jara Joel | $100,000 |
Source: Public Records
Tax History Compared to Growth
Tax History
| Year | Tax Paid | Tax Assessment Tax Assessment Total Assessment is a certain percentage of the fair market value that is determined by local assessors to be the total taxable value of land and additions on the property. | Land | Improvement |
|---|---|---|---|---|
| 2024 | $513 | $45,200 | $7,250 | $37,950 |
| 2023 | $513 | $45,200 | $0 | $0 |
| 2022 | $513 | $45,200 | $7,250 | $37,950 |
| 2021 | $412 | $26,300 | $5,475 | $20,825 |
| 2020 | $412 | $26,300 | $5,475 | $20,825 |
| 2019 | $415 | $26,500 | $5,475 | $21,025 |
| 2018 | $415 | $26,500 | $5,475 | $21,025 |
| 2017 | $415 | $26,500 | $5,475 | $21,025 |
| 2016 | $401 | $26,275 | $5,475 | $20,800 |
| 2015 | $393 | $26,275 | $5,475 | $20,800 |
| 2014 | $382 | $25,488 | $0 | $0 |
Source: Public Records
Map
Nearby Homes
- 0 Old Tanner Cemetery Rd Unit 239306
- 0 Old Tanner Cemetery Rd Unit 239305
- 0 Old Tanner Cemetery Rd Unit 239308
- 1215 Pomona Rd
- 104 Lakyn Dr
- 871 Pomona Rd
- 0 Old Highway 70
- 323 Noah Ln
- 5.76 Pomona Rd
- 181 Pomona Rd
- 458 Pomona Rd
- 8820 Sparta Hwy
- 281 Red Williams Rd
- 6419 Highway 70 N
- 0 Hwy 70 N Unit 1317197
- 185 Tanglewood Trail
- 37 Windy Acres Dr
- 759 Pow Camp Rd
- 3571 Sparta Hwy Unit 3571
- 170 Bob Austin Rd
- 1510 Claysville Rd
- 1639 Claysville Rd
- 0 Tanner Dr
- 190 Old Tanner Cemetary Rd
- 190 Tanner Cemetery Rd
- 00 Claysville Rd
- 1391 Claysville Rd
- 1742 Claysville Rd
- 1759 Claysville Rd
- Lot 2 Claysville Rd
- Lot 12 Tanner Way
- Lot 5 Tanner Way
- 0 Tanner Trail Unit 908161
- 0 Tanner Trail Unit 908160
- 0 Tanner Trail Unit 908159
- 0 Tanner Trail Unit 908158
- 0 Tanner Trail Unit 1041732
- 0 Tanner Trail Unit 1041727
- 0 Tanner Trail Unit 1041733
- 0 Tanner Trail Unit 1041729