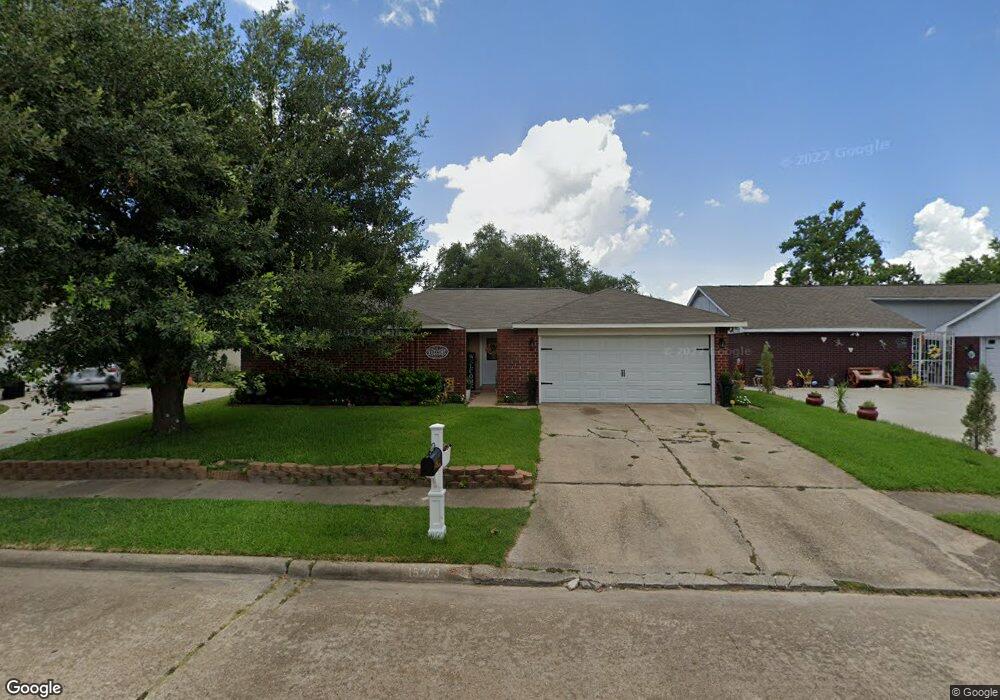
15243 Mincing Ln Channelview, TX 77530
Estimated Value: $210,000 - $234,000
3
Beds
2
Baths
1,464
Sq Ft
$149/Sq Ft
Est. Value
About This Home
This home is located at 15243 Mincing Ln, Channelview, TX 77530 and is currently estimated at $218,823, approximately $149 per square foot. 15243 Mincing Ln is a home located in Harris County with nearby schools including Channelview High School and Family Christian Academy.
Ownership History
Date
Name
Owned For
Owner Type
Purchase Details
Closed on
Aug 4, 2017
Sold by
Alvarado Nathaniel D and Alvarado Erica
Bought by
Cervantes Sammy
Current Estimated Value
Home Financials for this Owner
Home Financials are based on the most recent Mortgage that was taken out on this home.
Original Mortgage
$132,554
Outstanding Balance
$111,460
Interest Rate
4.25%
Mortgage Type
FHA
Estimated Equity
$107,363
Purchase Details
Closed on
Aug 28, 2009
Sold by
Wheeler Ruth Ann and Hebert Jerry
Bought by
Alvarado Nathaniel D
Home Financials for this Owner
Home Financials are based on the most recent Mortgage that was taken out on this home.
Original Mortgage
$98,090
Interest Rate
5.16%
Mortgage Type
FHA
Purchase Details
Closed on
Mar 30, 1998
Sold by
Wheeler Gary Lynn
Bought by
Wheeler Ruth Ann
Create a Home Valuation Report for This Property
The Home Valuation Report is an in-depth analysis detailing your home's value as well as a comparison with similar homes in the area
Home Values in the Area
Average Home Value in this Area
Purchase History
| Date | Buyer | Sale Price | Title Company |
|---|---|---|---|
| Cervantes Sammy | -- | Capital Title | |
| Alvarado Nathaniel D | -- | First American Title Ins Co | |
| Wheeler Ruth Ann | -- | -- |
Source: Public Records
Mortgage History
| Date | Status | Borrower | Loan Amount |
|---|---|---|---|
| Open | Cervantes Sammy | $132,554 | |
| Previous Owner | Alvarado Nathaniel D | $98,090 |
Source: Public Records
Tax History Compared to Growth
Tax History
| Year | Tax Paid | Tax Assessment Tax Assessment Total Assessment is a certain percentage of the fair market value that is determined by local assessors to be the total taxable value of land and additions on the property. | Land | Improvement |
|---|---|---|---|---|
| 2025 | $2,967 | $202,700 | $37,015 | $165,685 |
| 2024 | $2,967 | $208,642 | $37,015 | $171,627 |
| 2023 | $2,967 | $211,820 | $37,015 | $174,805 |
| 2022 | $4,062 | $185,469 | $37,015 | $148,454 |
| 2021 | $3,911 | $159,445 | $37,015 | $122,430 |
| 2020 | $3,886 | $141,198 | $37,015 | $104,183 |
| 2019 | $3,918 | $136,966 | $31,075 | $105,891 |
| 2018 | $1,760 | $126,060 | $30,049 | $96,011 |
| 2017 | $3,267 | $126,060 | $30,049 | $96,011 |
| 2016 | $2,970 | $109,283 | $20,734 | $88,549 |
| 2015 | $2,294 | $99,380 | $12,020 | $87,360 |
| 2014 | $2,294 | $87,002 | $12,020 | $74,982 |
Source: Public Records
Map
Nearby Homes
- 15223 Bedford Glen Dr
- 15262 Mincing Ln
- 1502 Stevenage Ln
- 15307 Streatham Cir
- 1527 Wrotham Ln
- 1330 Stevenage Ln
- 15215 Peachmeadow Ln
- 15318 Streatham Cir
- 1315 Goswell Ln
- 1343 Littleport Ln
- 1130 Fairlane Square
- 1727 Mickle Creek Dr
- 1231 Nuevo Carrasco Ln
- 16111 Marcelia Dr
- 15458 Casita Verde Way
- 15451 Refugio Verde Way
- 16206 Darrian Ln
- 1818 Mickle Creek Dr
- 1123 Maclesby Ln
- 15470 Rancho Joya Way
- 15247 Mincing Ln
- 15239 Mincing Ln
- 15246 Bedford Glen Dr
- 15242 Bedford Glen Dr
- 15235 Mincing Ln
- 15251 Mincing Ln
- 15250 Bedford Glen Dr
- 15238 Bedford Glen Dr
- 15242 Mincing Ln
- 15254 Bedford Glen Dr
- 15246 Mincing Ln
- 15238 Mincing Ln
- 15234 Bedford Glen Dr
- 15231 Mincing Ln
- 15255 Mincing Ln
- 15250 Mincing Ln
- 15258 Bedford Glen Dr
- 15234 Mincing Ln
- 15230 Bedford Glen Dr
- 15259 Mincing Ln