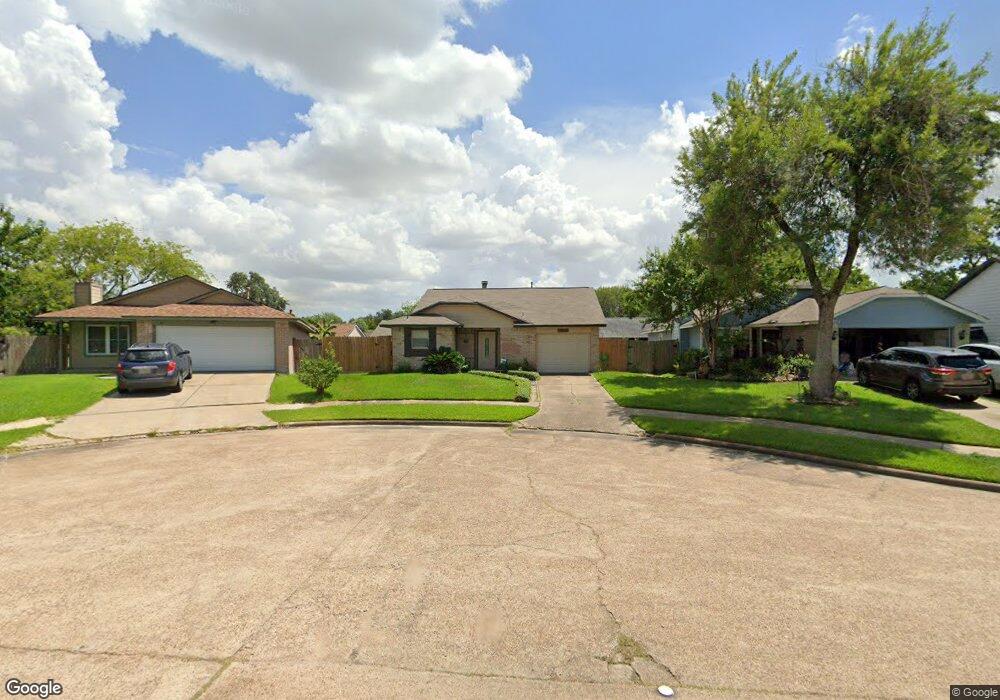
15262 Bedford Glen Dr Channelview, TX 77530
Estimated Value: $161,840 - $184,000
2
Beds
1
Bath
947
Sq Ft
$182/Sq Ft
Est. Value
About This Home
This home is located at 15262 Bedford Glen Dr, Channelview, TX 77530 and is currently estimated at $172,210, approximately $181 per square foot. 15262 Bedford Glen Dr is a home located in Harris County with nearby schools including Channelview High School and Family Christian Academy.
Ownership History
Date
Name
Owned For
Owner Type
Purchase Details
Closed on
Sep 15, 2006
Sold by
Henry Chandra and Henry Patrick
Bought by
Muhammad Patrick and Muhammad Chandra
Current Estimated Value
Home Financials for this Owner
Home Financials are based on the most recent Mortgage that was taken out on this home.
Original Mortgage
$63,000
Outstanding Balance
$49,573
Interest Rate
13.56%
Mortgage Type
Purchase Money Mortgage
Estimated Equity
$122,637
Purchase Details
Closed on
Jul 31, 2001
Sold by
Pennington Joan Ellen and Pennington Ken
Bought by
Henry Patrick and Henry Chandra
Home Financials for this Owner
Home Financials are based on the most recent Mortgage that was taken out on this home.
Original Mortgage
$48,600
Interest Rate
9.88%
Purchase Details
Closed on
Jan 3, 1995
Sold by
Penney Floyd D and Penney Joan Ellen
Bought by
Pennington Joan E
Create a Home Valuation Report for This Property
The Home Valuation Report is an in-depth analysis detailing your home's value as well as a comparison with similar homes in the area
Home Values in the Area
Average Home Value in this Area
Purchase History
| Date | Buyer | Sale Price | Title Company |
|---|---|---|---|
| Muhammad Patrick | -- | Fidelity National Title Co | |
| Henry Patrick | -- | Texas American Title | |
| Pennington Joan E | -- | -- |
Source: Public Records
Mortgage History
| Date | Status | Borrower | Loan Amount |
|---|---|---|---|
| Open | Muhammad Patrick | $63,000 | |
| Previous Owner | Henry Patrick | $48,600 |
Source: Public Records
Tax History Compared to Growth
Tax History
| Year | Tax Paid | Tax Assessment Tax Assessment Total Assessment is a certain percentage of the fair market value that is determined by local assessors to be the total taxable value of land and additions on the property. | Land | Improvement |
|---|---|---|---|---|
| 2025 | $3,028 | $146,074 | $36,401 | $109,673 |
| 2024 | $3,028 | $148,159 | $36,401 | $111,758 |
| 2023 | $3,028 | $152,166 | $36,401 | $115,765 |
| 2022 | $3,198 | $134,496 | $36,401 | $98,095 |
| 2021 | $2,983 | $118,449 | $36,401 | $82,048 |
| 2020 | $2,890 | $105,008 | $36,401 | $68,607 |
| 2019 | $2,868 | $100,273 | $30,559 | $69,714 |
| 2018 | $1,212 | $86,848 | $26,070 | $60,778 |
| 2017 | $2,539 | $86,848 | $26,070 | $60,778 |
| 2016 | $2,360 | $80,744 | $19,031 | $61,713 |
| 2015 | $1,786 | $65,803 | $11,471 | $54,332 |
| 2014 | $1,786 | $57,079 | $11,471 | $45,608 |
Source: Public Records
Map
Nearby Homes
- 15262 Mincing Ln
- 15223 Bedford Glen Dr
- 15307 Streatham Cir
- 1527 Wrotham Ln
- 1502 Stevenage Ln
- 15318 Streatham Cir
- 15215 Peachmeadow Ln
- 1330 Stevenage Ln
- 1315 Goswell Ln
- 1130 Fairlane Square
- 1231 Nuevo Carrasco Ln
- 1727 Mickle Creek Dr
- 1343 Littleport Ln
- 15458 Casita Verde Way
- 15451 Refugio Verde Way
- 16111 Marcelia Dr
- 15470 Rancho Joya Way
- 1818 Mickle Creek Dr
- 16206 Darrian Ln
- 16435 Peyton Ridge Cir
- 15258 Bedford Glen Dr
- 15266 Bedford Glen Dr
- 15259 Mincing Ln
- 15255 Mincing Ln
- 15254 Bedford Glen Dr
- 1402 Goswell Ln
- 15263 Mincing Ln
- 15251 Mincing Ln
- 1406 Goswell Ln
- 15267 Mincing Ln
- 15250 Bedford Glen Dr
- 1407 Wrotham Ln
- 1403 Wrotham Ln
- 15259 Bedford Glen Dr
- 15247 Mincing Ln
- 1410 Goswell Ln
- 15271 Mincing Ln
- 15255 Bedford Glen Dr
- 1411 Wrotham Ln
- 15246 Bedford Glen Dr