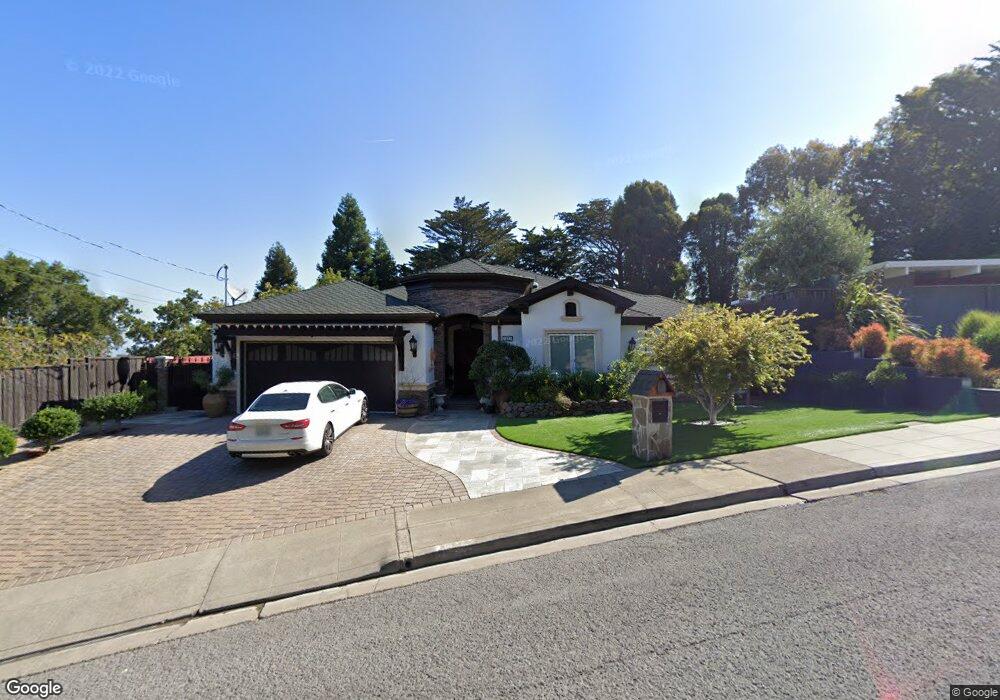
1527 Brandywine Rd San Mateo, CA 94402
San Mateo Highlands NeighborhoodEstimated Value: $2,826,000 - $3,901,353
4
Beds
2
Baths
2,650
Sq Ft
$1,273/Sq Ft
Est. Value
About This Home
This home is located at 1527 Brandywine Rd, San Mateo, CA 94402 and is currently estimated at $3,372,338, approximately $1,272 per square foot. 1527 Brandywine Rd is a home located in San Mateo County with nearby schools including Highlands Elementary School, Borel Middle School, and Aragon High School.
Ownership History
Date
Name
Owned For
Owner Type
Purchase Details
Closed on
Feb 16, 2024
Sold by
Nguyen Simone Phuoc
Bought by
Simone Phuoc Nguyen Living Trust and Nguyen
Current Estimated Value
Purchase Details
Closed on
Jun 23, 2010
Sold by
Nguyen Simone
Bought by
Nguyen Simone
Purchase Details
Closed on
Aug 6, 2009
Sold by
Nickravesh Nick K and Nickravesh Sonbol
Bought by
Nguyen Simone
Home Financials for this Owner
Home Financials are based on the most recent Mortgage that was taken out on this home.
Original Mortgage
$350,000
Interest Rate
5.3%
Mortgage Type
New Conventional
Purchase Details
Closed on
Jun 22, 2009
Sold by
Nguyen Stevis
Bought by
Nguyen Simone P
Home Financials for this Owner
Home Financials are based on the most recent Mortgage that was taken out on this home.
Original Mortgage
$350,000
Interest Rate
5.3%
Mortgage Type
New Conventional
Create a Home Valuation Report for This Property
The Home Valuation Report is an in-depth analysis detailing your home's value as well as a comparison with similar homes in the area
Home Values in the Area
Average Home Value in this Area
Purchase History
| Date | Buyer | Sale Price | Title Company |
|---|---|---|---|
| Simone Phuoc Nguyen Living Trust | -- | None Listed On Document | |
| Nguyen Simone Phuoc | -- | None Listed On Document | |
| Nguyen Simone | -- | None Available | |
| Nguyen Simone | $1,300,000 | Fidelity National Title Co | |
| Nguyen Simone P | -- | Fidelity National Title Co |
Source: Public Records
Mortgage History
| Date | Status | Borrower | Loan Amount |
|---|---|---|---|
| Previous Owner | Nguyen Simone P | $350,000 |
Source: Public Records
Tax History Compared to Growth
Tax History
| Year | Tax Paid | Tax Assessment Tax Assessment Total Assessment is a certain percentage of the fair market value that is determined by local assessors to be the total taxable value of land and additions on the property. | Land | Improvement |
|---|---|---|---|---|
| 2025 | $21,663 | $1,751,426 | $839,027 | $912,399 |
| 2023 | $21,663 | $1,683,420 | $806,448 | $876,972 |
| 2022 | $20,874 | $1,650,414 | $790,636 | $859,778 |
| 2021 | $20,519 | $1,618,055 | $775,134 | $842,921 |
| 2020 | $19,834 | $1,601,465 | $767,186 | $834,279 |
| 2019 | $19,318 | $1,570,065 | $752,144 | $817,921 |
| 2018 | $18,641 | $1,539,281 | $737,397 | $801,884 |
| 2017 | $18,384 | $1,509,100 | $722,939 | $786,161 |
| 2016 | $18,244 | $1,479,511 | $708,764 | $770,747 |
| 2015 | $17,854 | $1,457,289 | $698,118 | $759,171 |
| 2014 | $17,437 | $1,428,744 | $684,443 | $744,301 |
Source: Public Records
Map
Nearby Homes
- 1276 Laurel Hill Dr
- 2224 Bunker Hill Dr
- 1485 Ascension Dr
- 45 Calaveras Ct
- 30 Calaveras Ct
- 8 Bel Aire Rd
- 25 Searsville Ct
- 1426 Bel Aire Rd
- 38 Bel Aire Rd
- 28 Bel Aire Rd
- 1342 Bel Aire Rd
- 48 Bel Aire Rd
- 58 Bel Aire Rd
- 1764 Lexington Ave
- 1575 Parrott Dr
- 1712 Los Altos Dr
- 30 Bluebell Ln
- 1430 Lakeview Dr
- 1485 Oak Rim Dr
- 1531 Wedgewood Dr
- 1531 Brandywine Rd
- 1523 Brandywine Rd
- 1519 Brandywine Rd
- 1530 Brandywine Rd
- 25 Fairfield Ct
- 30 Fairfield Ct
- 1515 Brandywine Rd
- 10 Fairfield Ct
- 1526 Brandywine Rd
- 1536 Brandywine Rd
- 20 Fairfield Ct
- 1520 Brandywine Rd
- 1509 Brandywine Rd
- 1514 Brandywine Rd
- 1542 Brandywine Rd
- 1541 Brandywine Rd
- 1508 Brandywine Rd
- 60 Trenton Place
- 1505 Brandywine Rd
- 1548 Brandywine Rd