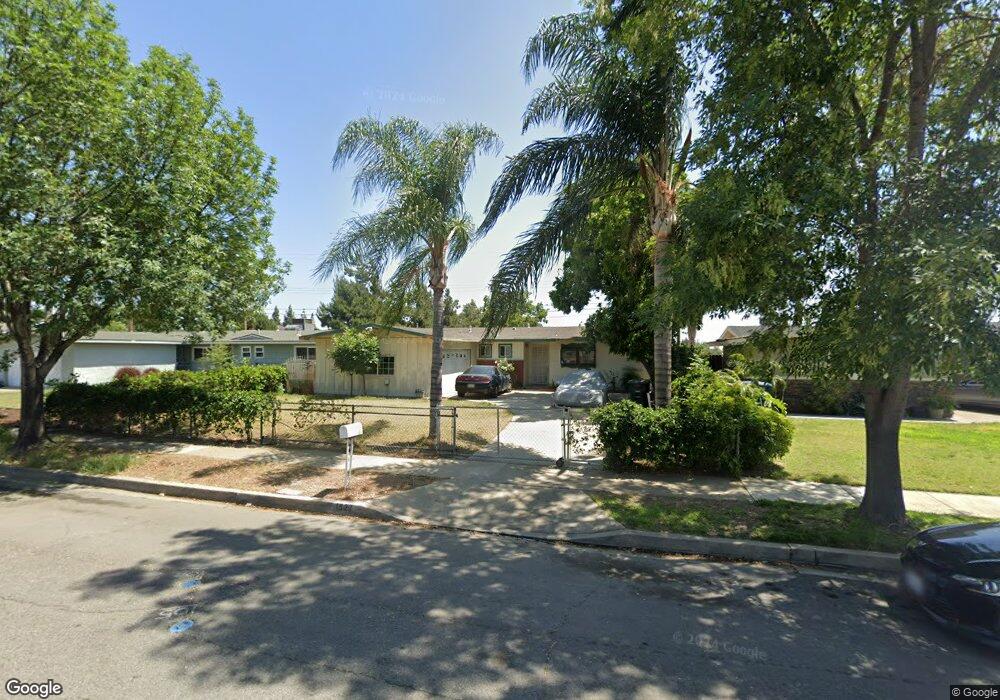
1527 W H St Ontario, CA 91762
Downtown Ontario NeighborhoodEstimated Value: $588,239 - $672,000
3
Beds
2
Baths
1,152
Sq Ft
$560/Sq Ft
Est. Value
About This Home
This home is located at 1527 W H St, Ontario, CA 91762 and is currently estimated at $645,560, approximately $560 per square foot. 1527 W H St is a home located in San Bernardino County with nearby schools including Elderberry Elementary, Vernon Middle School, and Montclair High School.
Ownership History
Date
Name
Owned For
Owner Type
Purchase Details
Closed on
Feb 11, 2013
Sold by
Anita Santacrea Julio Cesar
Bought by
Santacreau Julio Cesar
Current Estimated Value
Home Financials for this Owner
Home Financials are based on the most recent Mortgage that was taken out on this home.
Original Mortgage
$256,500
Outstanding Balance
$178,893
Interest Rate
3.36%
Mortgage Type
New Conventional
Estimated Equity
$466,667
Purchase Details
Closed on
Jun 2, 2004
Sold by
Ortiz Rudolph R
Bought by
Santacrew Julio C
Home Financials for this Owner
Home Financials are based on the most recent Mortgage that was taken out on this home.
Original Mortgage
$192,000
Interest Rate
6.27%
Mortgage Type
Purchase Money Mortgage
Purchase Details
Closed on
Oct 5, 2000
Sold by
Turnbow Reginald T
Bought by
Ortiz Rudolph R
Home Financials for this Owner
Home Financials are based on the most recent Mortgage that was taken out on this home.
Original Mortgage
$127,205
Interest Rate
12.1%
Create a Home Valuation Report for This Property
The Home Valuation Report is an in-depth analysis detailing your home's value as well as a comparison with similar homes in the area
Home Values in the Area
Average Home Value in this Area
Purchase History
| Date | Buyer | Sale Price | Title Company |
|---|---|---|---|
| Santacreau Julio Cesar | -- | Spl Title Services | |
| Santacrew Julio C | $240,000 | Investors Title | |
| Ortiz Rudolph R | $134,000 | United Title |
Source: Public Records
Mortgage History
| Date | Status | Borrower | Loan Amount |
|---|---|---|---|
| Open | Santacreau Julio Cesar | $256,500 | |
| Previous Owner | Santacrew Julio C | $192,000 | |
| Previous Owner | Ortiz Rudolph R | $127,205 | |
| Closed | Santacrew Julio C | $36,000 |
Source: Public Records
Tax History Compared to Growth
Tax History
| Year | Tax Paid | Tax Assessment Tax Assessment Total Assessment is a certain percentage of the fair market value that is determined by local assessors to be the total taxable value of land and additions on the property. | Land | Improvement |
|---|---|---|---|---|
| 2025 | $3,526 | $334,541 | $117,090 | $217,451 |
| 2024 | $3,526 | $327,981 | $114,794 | $213,187 |
| 2023 | $3,425 | $321,550 | $112,543 | $209,007 |
| 2022 | $3,378 | $315,245 | $110,336 | $204,909 |
| 2021 | $3,356 | $309,064 | $108,173 | $200,891 |
| 2020 | $3,296 | $305,895 | $107,064 | $198,831 |
| 2019 | $3,267 | $299,897 | $104,965 | $194,932 |
| 2018 | $3,220 | $294,017 | $102,907 | $191,110 |
| 2017 | $3,103 | $288,252 | $100,889 | $187,363 |
| 2016 | $2,979 | $282,600 | $98,911 | $183,689 |
| 2015 | $2,958 | $278,355 | $97,425 | $180,930 |
| 2014 | $2,865 | $272,903 | $95,517 | $177,386 |
Source: Public Records
Map
Nearby Homes
- 853 N Jasmine Ave
- 1352 W Granada Ct
- 9932 Santa Anita Ave
- 9966 Vernon Ave
- 1415 W Harvard Place
- 1164 W I St
- 1353 W Princeton St
- 1105 W Berkeley Ct
- 1111 W J St
- 1516 W Stoneridge Ct
- 456 N Begonia Ave
- 1326 W Oakcrest Paseo
- 1324 W Oakcrest Paseo
- 5635 Palo Verde St
- Plan 3 at Canopy
- Plan 4 at Canopy
- 1163 W Princeton St
- 1147 W D St
- 1111 W E St
- 5573 Bonnie Brae St