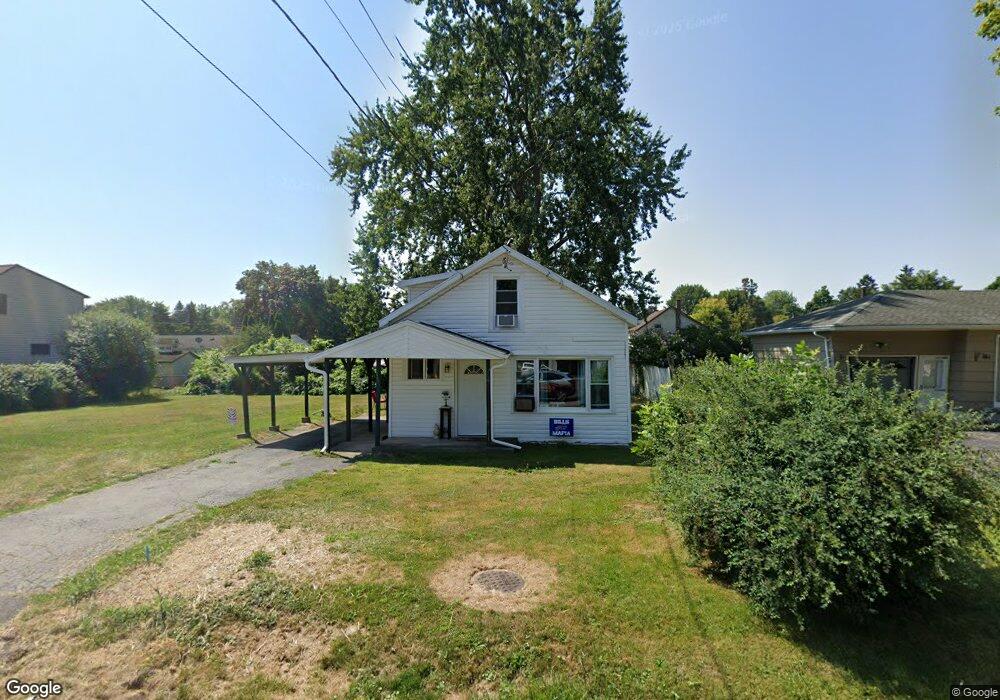
153 Calhoun Ave Rochester, NY 14606
Estimated Value: $125,651 - $163,000
1
Bed
1
Bath
672
Sq Ft
$212/Sq Ft
Est. Value
About This Home
This home is located at 153 Calhoun Ave, Rochester, NY 14606 and is currently estimated at $142,163, approximately $211 per square foot. 153 Calhoun Ave is a home located in Monroe County with nearby schools including Gates-Chili Middle School, Gates-Chili High School, and Northstar Christian Academy.
Ownership History
Date
Name
Owned For
Owner Type
Purchase Details
Closed on
Jun 26, 2023
Sold by
Town Of Gates
Bought by
Mjd Holdings Of Wny Llc
Current Estimated Value
Purchase Details
Closed on
May 1, 2020
Sold by
Rossi Frank
Bought by
Fund 1 Llc
Purchase Details
Closed on
Sep 19, 2005
Sold by
Jj Goldmine Inc
Bought by
Rossi Frank
Home Financials for this Owner
Home Financials are based on the most recent Mortgage that was taken out on this home.
Original Mortgage
$53,910
Interest Rate
8.6%
Mortgage Type
Adjustable Rate Mortgage/ARM
Purchase Details
Closed on
Jul 15, 2005
Sold by
Homecomings Financial Ntw
Bought by
Jj Goldmine Inc
Purchase Details
Closed on
Feb 15, 2005
Sold by
Odell Deborah
Bought by
Homecomings Financial Ntw
Purchase Details
Closed on
Apr 29, 2003
Sold by
O'Dell Michael P
Bought by
O'Dell Deborah L
Purchase Details
Closed on
Sep 10, 1998
Sold by
Kuhn Christine M
Bought by
O'Dell Michael P and O'Dell Deborah L
Create a Home Valuation Report for This Property
The Home Valuation Report is an in-depth analysis detailing your home's value as well as a comparison with similar homes in the area
Home Values in the Area
Average Home Value in this Area
Purchase History
| Date | Buyer | Sale Price | Title Company |
|---|---|---|---|
| Mjd Holdings Of Wny Llc | $28,000 | None Listed On Document | |
| Fund 1 Llc | $30,000 | Chicago Title Rochester | |
| Rossi Frank | $59,900 | -- | |
| Jj Goldmine Inc | $23,500 | John Nacca | |
| Homecomings Financial Ntw | $63,496 | -- | |
| O'Dell Deborah L | -- | -- | |
| O'Dell Michael P | $55,000 | -- |
Source: Public Records
Mortgage History
| Date | Status | Borrower | Loan Amount |
|---|---|---|---|
| Previous Owner | Rossi Frank | $53,910 |
Source: Public Records
Tax History Compared to Growth
Tax History
| Year | Tax Paid | Tax Assessment Tax Assessment Total Assessment is a certain percentage of the fair market value that is determined by local assessors to be the total taxable value of land and additions on the property. | Land | Improvement |
|---|---|---|---|---|
| 2024 | $3,593 | $76,100 | $23,000 | $53,100 |
| 2023 | $5,593 | $76,100 | $23,000 | $53,100 |
| 2022 | $5,859 | $76,100 | $23,000 | $53,100 |
| 2021 | $5,402 | $76,100 | $23,000 | $53,100 |
| 2020 | $3,242 | $76,100 | $23,000 | $53,100 |
| 2019 | $6,429 | $62,400 | $23,000 | $39,400 |
| 2018 | $4,696 | $62,400 | $23,000 | $39,400 |
| 2017 | $1,657 | $62,400 | $23,000 | $39,400 |
| 2016 | $6,429 | $62,400 | $23,000 | $39,400 |
| 2015 | -- | $60,600 | $23,000 | $37,600 |
| 2014 | -- | $60,600 | $23,000 | $37,600 |
Source: Public Records
Map
Nearby Homes
- 61 Calhoun Ave
- 134 Norwood Ave
- 80 Downsview Dr
- 312 Auburn Ave
- 97 Youngs Ave
- 0 Vendome Dr S
- 141 Auburn Ave
- 69 Lightwood Ln
- 80 Auburn Ave
- 135 Pilot St
- 38 Regina Dr
- 27 Ezio Dr
- 27 Country Gables Cir
- 2381 Long Pond Rd
- 2986 Lyell Rd
- 21 W Crest Dr
- 2989 Lyell Rd
- 210 Fox Run
- 95 Kimberly Anne Dr
- 78 Kimberly Anne Dr
- 161 Calhoun Ave
- 137 Calhoun Ave
- 162 Waldorf Ave
- 164 Waldorf Ave
- 148 Calhoun Ave
- 158 Calhoun Ave
- 171 Calhoun Ave
- 129 Calhoun Ave
- 178 Waldorf Ave
- 138 Waldorf Ave
- 166 Calhoun Ave
- 128 Calhoun Ave
- 174 Calhoun Ave
- 188 Waldorf Ave
- 181 Calhoun Ave
- 159 Waldorf Ave
- 149 Waldorf Ave
- 169 Waldorf Ave
- 180 Calhoun Ave
- 141 Waldorf Ave