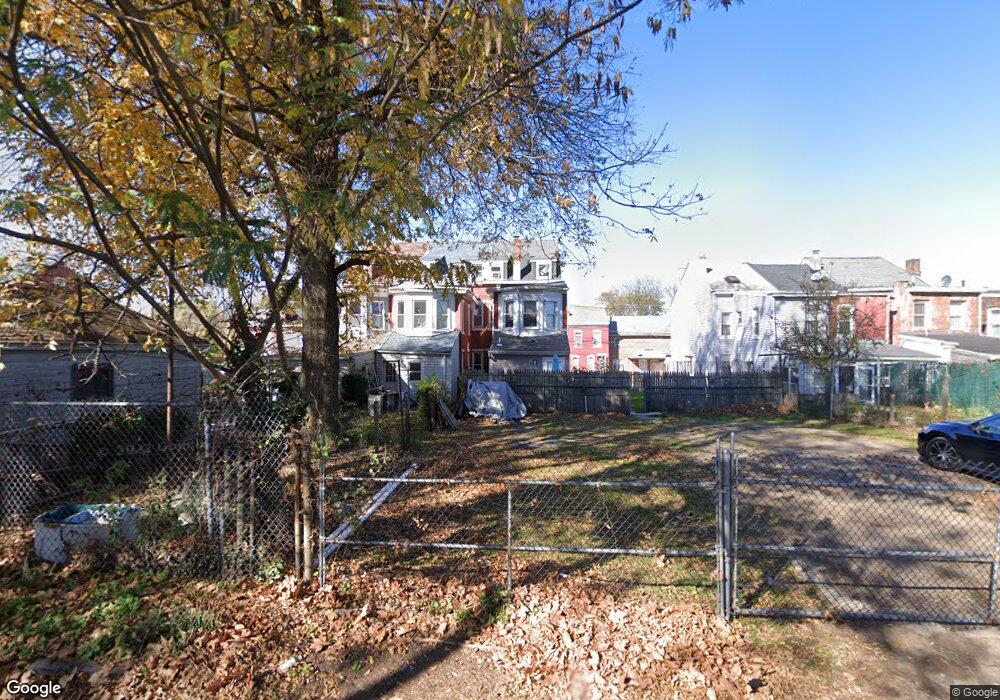
153 Locust St Trenton, NJ 08609
Greenwood & Hamilton NeighborhoodEstimated Value: $120,000 - $207,000
--
Bed
--
Bath
1,267
Sq Ft
$133/Sq Ft
Est. Value
About This Home
This home is located at 153 Locust St, Trenton, NJ 08609 and is currently estimated at $168,591, approximately $133 per square foot. 153 Locust St is a home located in Mercer County with nearby schools including P.J. Hill Elementary School, Grant Elementary School, and Dr. Martin Luther King Middle School.
Ownership History
Date
Name
Owned For
Owner Type
Purchase Details
Closed on
Dec 28, 2017
Sold by
Lopez Zuleman Perez
Bought by
Estrand Jasmine Melissa
Current Estimated Value
Purchase Details
Closed on
Feb 11, 2014
Sold by
Moses Samantha
Bought by
Lopez Zulema Perez
Purchase Details
Closed on
May 14, 2008
Sold by
Bowser Calvin
Bought by
Moses Samantha
Purchase Details
Closed on
Oct 2, 2007
Sold by
Plymouth Pk Tax Svcs Llc
Bought by
Bowser Calvin
Create a Home Valuation Report for This Property
The Home Valuation Report is an in-depth analysis detailing your home's value as well as a comparison with similar homes in the area
Home Values in the Area
Average Home Value in this Area
Purchase History
| Date | Buyer | Sale Price | Title Company |
|---|---|---|---|
| Estrand Jasmine Melissa | -- | Emerald Title Agency | |
| Lopez Zulema Perez | $36,000 | Emerald Title Agency | |
| Moses Samantha | -- | -- | |
| Bowser Calvin | $23,500 | -- |
Source: Public Records
Tax History Compared to Growth
Tax History
| Year | Tax Paid | Tax Assessment Tax Assessment Total Assessment is a certain percentage of the fair market value that is determined by local assessors to be the total taxable value of land and additions on the property. | Land | Improvement |
|---|---|---|---|---|
| 2025 | $2,616 | $45,100 | $5,900 | $39,200 |
| 2024 | $2,511 | $45,100 | $5,900 | $39,200 |
| 2023 | $2,511 | $45,100 | $5,900 | $39,200 |
| 2022 | $2,462 | $45,100 | $5,900 | $39,200 |
| 2021 | $2,504 | $45,100 | $5,900 | $39,200 |
| 2020 | $2,496 | $45,100 | $5,900 | $39,200 |
| 2019 | $2,456 | $45,100 | $5,900 | $39,200 |
| 2018 | $2,351 | $45,100 | $5,900 | $39,200 |
| 2017 | $2,235 | $45,100 | $5,900 | $39,200 |
| 2016 | $3,504 | $60,900 | $6,100 | $54,800 |
| 2015 | $3,491 | $60,900 | $6,100 | $54,800 |
| 2014 | $3,475 | $60,900 | $6,100 | $54,800 |
Source: Public Records
Map
Nearby Homes