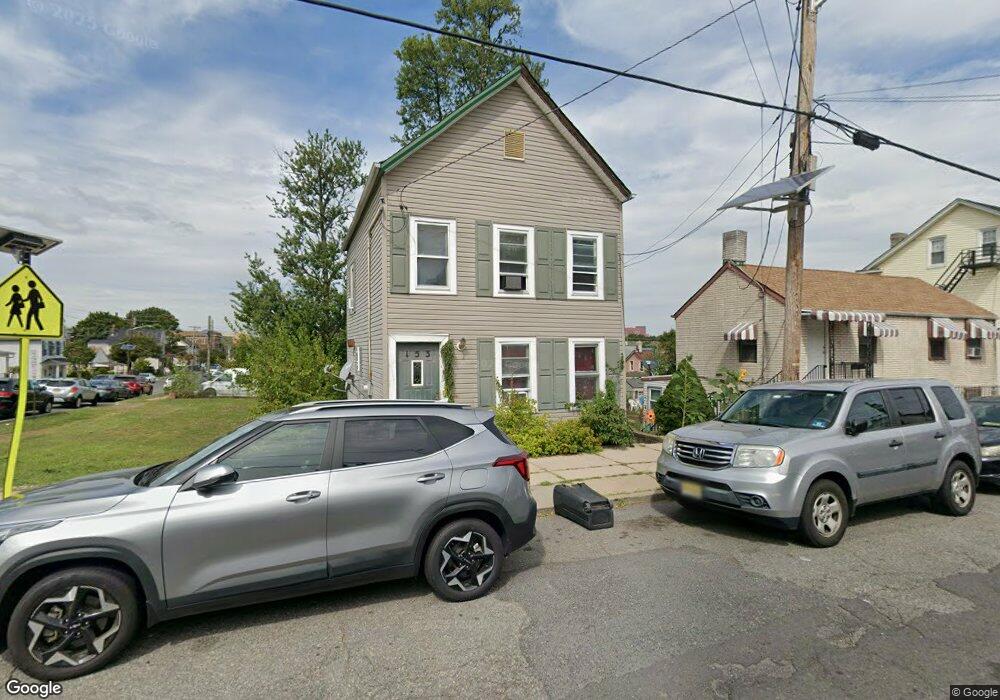
153 Throop Ave New Brunswick, NJ 08901
Estimated Value: $282,000 - $320,000
2
Beds
1
Bath
936
Sq Ft
$315/Sq Ft
Est. Value
About This Home
This home is located at 153 Throop Ave, New Brunswick, NJ 08901 and is currently estimated at $294,377, approximately $314 per square foot. 153 Throop Ave is a home located in Middlesex County with nearby schools including New Brunswick High School, Central Jersey College Prep Charter School, and St. Mary of Mount Virgin School.
Ownership History
Date
Name
Owned For
Owner Type
Purchase Details
Closed on
Nov 2, 2018
Sold by
Dai Jiqiong and Jin Yonghong Jin
Bought by
Jin701 Property Holding L Lc
Current Estimated Value
Home Financials for this Owner
Home Financials are based on the most recent Mortgage that was taken out on this home.
Original Mortgage
$138,750
Outstanding Balance
$122,077
Interest Rate
4.83%
Estimated Equity
$172,300
Purchase Details
Closed on
Feb 26, 2018
Sold by
Federal Home Loan Mortgage Corporation
Bought by
Dai Jiqiong and Jin Yonghong
Purchase Details
Closed on
Sep 17, 2015
Sold by
Duncan Aretha
Bought by
Bank Of America N A
Purchase Details
Closed on
Nov 23, 2005
Sold by
Schraier Mario
Bought by
Duncan Aretha
Home Financials for this Owner
Home Financials are based on the most recent Mortgage that was taken out on this home.
Original Mortgage
$152,000
Interest Rate
6.17%
Create a Home Valuation Report for This Property
The Home Valuation Report is an in-depth analysis detailing your home's value as well as a comparison with similar homes in the area
Home Values in the Area
Average Home Value in this Area
Purchase History
| Date | Buyer | Sale Price | Title Company |
|---|---|---|---|
| Jin701 Property Holding L Lc | -- | -- | |
| Dai Jiqiong | $80,000 | Quality Title & Abstract Age | |
| Bank Of America N A | -- | None Available | |
| Duncan Aretha | $190,000 | -- |
Source: Public Records
Mortgage History
| Date | Status | Borrower | Loan Amount |
|---|---|---|---|
| Open | Jin701 Property Holding L Lc | $138,750 | |
| Closed | Jin701 Property Holding L Lc | -- | |
| Previous Owner | Duncan Aretha | $152,000 |
Source: Public Records
Tax History Compared to Growth
Tax History
| Year | Tax Paid | Tax Assessment Tax Assessment Total Assessment is a certain percentage of the fair market value that is determined by local assessors to be the total taxable value of land and additions on the property. | Land | Improvement |
|---|---|---|---|---|
| 2025 | $3,936 | $150,300 | $75,000 | $75,300 |
| 2024 | $3,822 | $150,300 | $75,000 | $75,300 |
| 2023 | $3,822 | $150,300 | $75,000 | $75,300 |
| 2022 | $3,741 | $150,300 | $75,000 | $75,300 |
| 2021 | $2,775 | $150,300 | $75,000 | $75,300 |
| 2020 | $3,712 | $150,300 | $75,000 | $75,300 |
| 2019 | $3,642 | $150,300 | $75,000 | $75,300 |
| 2018 | $3,559 | $150,300 | $75,000 | $75,300 |
| 2017 | $3,418 | $150,300 | $75,000 | $75,300 |
| 2016 | $4,312 | $73,500 | $22,500 | $51,000 |
| 2015 | $4,209 | $73,500 | $22,500 | $51,000 |
| 2014 | $4,134 | $73,500 | $22,500 | $51,000 |
Source: Public Records
Map
Nearby Homes
- 220 Paul Robeson Blvd
- 72 Comstock St
- 128 Remsen Ave Unit A
- 128A Remsen Ave
- 122B Remsen Ave Unit A
- 122A Remsen Ave Unit A
- 97 Throop Ave
- 146 Seaman St
- 158 Lee Ave
- 133 Suydam St
- 15 N Talmadge St
- 55 Suydam St
- 73 Remsen Ave
- 18 N Talmadge St
- 216 Handy St
- 79 Nichol Ave
- 122 Lawrence St Unit 26
- 200 Talmadge St
- 186 Townsend St
- 34 Lee Ave