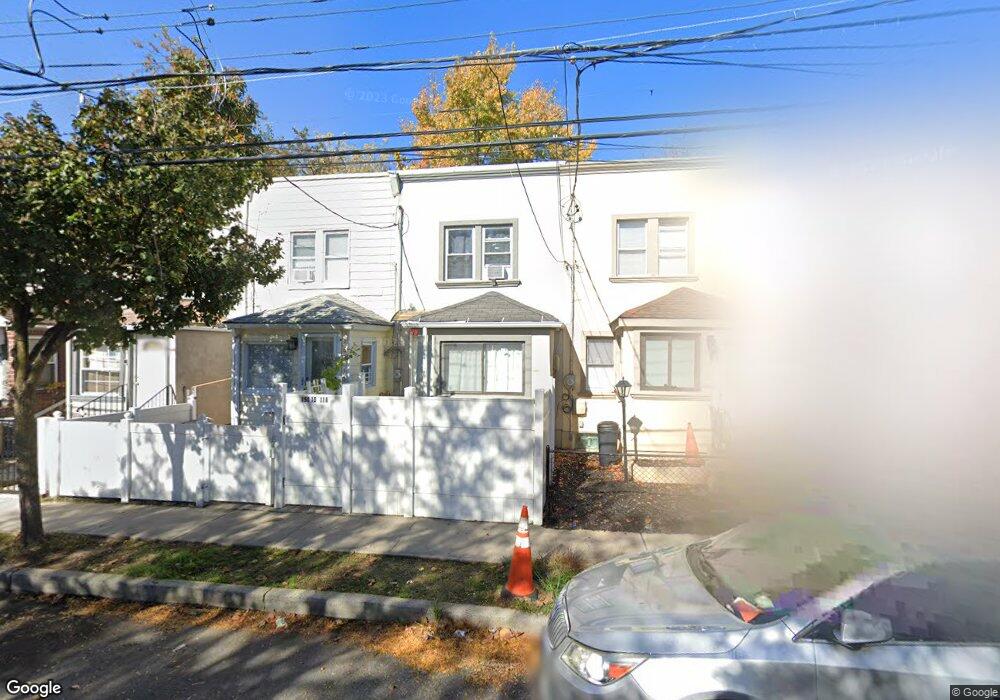
15315 118th Ave Jamaica, NY 11434
South Jamaica NeighborhoodEstimated Value: $441,000 - $558,000
--
Bed
--
Bath
676
Sq Ft
$771/Sq Ft
Est. Value
About This Home
This home is located at 15315 118th Ave, Jamaica, NY 11434 and is currently estimated at $521,294, approximately $771 per square foot. 15315 118th Ave is a home located in Queens County with nearby schools including P.S. 223 - Lyndon B. Johnson, J.H.S. 226 Virgil I. Grisson, and Rochdale Early Advantage Charter School.
Ownership History
Date
Name
Owned For
Owner Type
Purchase Details
Closed on
Jun 13, 2022
Sold by
Bepari Rozel
Bought by
Dembry Elijah
Current Estimated Value
Home Financials for this Owner
Home Financials are based on the most recent Mortgage that was taken out on this home.
Original Mortgage
$460,750
Outstanding Balance
$438,329
Interest Rate
5.25%
Mortgage Type
Purchase Money Mortgage
Estimated Equity
$82,965
Purchase Details
Closed on
Aug 31, 2015
Sold by
Mazal Property Investors Llc
Bought by
Bepari Rozel
Home Financials for this Owner
Home Financials are based on the most recent Mortgage that was taken out on this home.
Original Mortgage
$289,656
Interest Rate
4.01%
Mortgage Type
New Conventional
Purchase Details
Closed on
Oct 2, 2014
Sold by
Harbe Brachot Llc
Bought by
Mazal Property Investors Llc
Purchase Details
Closed on
Aug 11, 2014
Sold by
Anna Mae Foreman As Survi Tentant By The
Bought by
Harbe Brachot Llc
Create a Home Valuation Report for This Property
The Home Valuation Report is an in-depth analysis detailing your home's value as well as a comparison with similar homes in the area
Home Values in the Area
Average Home Value in this Area
Purchase History
| Date | Buyer | Sale Price | Title Company |
|---|---|---|---|
| Dembry Elijah | $490,000 | -- | |
| Bepari Rozel | $295,000 | -- | |
| Mazal Property Investors Llc | $155,000 | -- | |
| Harbe Brachot Llc | $110,500 | -- |
Source: Public Records
Mortgage History
| Date | Status | Borrower | Loan Amount |
|---|---|---|---|
| Open | Dembry Elijah | $460,750 | |
| Previous Owner | Bepari Rozel | $289,656 |
Source: Public Records
Tax History Compared to Growth
Tax History
| Year | Tax Paid | Tax Assessment Tax Assessment Total Assessment is a certain percentage of the fair market value that is determined by local assessors to be the total taxable value of land and additions on the property. | Land | Improvement |
|---|---|---|---|---|
| 2025 | $2,798 | $14,768 | $4,340 | $10,428 |
| 2024 | $2,798 | $13,933 | $4,489 | $9,444 |
| 2023 | $2,650 | $13,194 | $4,724 | $8,470 |
| 2022 | $2,634 | $27,180 | $9,840 | $17,340 |
| 2021 | $2,745 | $24,060 | $9,840 | $14,220 |
| 2020 | $2,605 | $20,880 | $9,840 | $11,040 |
| 2019 | $2,429 | $19,920 | $9,840 | $10,080 |
| 2018 | $2,241 | $10,995 | $5,817 | $5,178 |
| 2017 | $2,241 | $10,995 | $5,835 | $5,160 |
| 2016 | $2,173 | $10,995 | $5,835 | $5,160 |
| 2015 | -- | $10,256 | $7,291 | $2,965 |
| 2014 | -- | $9,676 | $8,268 | $1,408 |
Source: Public Records
Map
Nearby Homes
- 15243 118th Ave
- 153-05 118th Ave
- 153-07 118th Ave
- 153-02 Foch Blvd
- 15070 Foch Blvd
- 15323 118th Ave
- 153-36 118th Ave
- 15209 118th Ave
- 11825 154th St
- 118-36 154th St
- 118-38 154th St
- 118-39 153rd St
- 11829 152nd St
- 15058 116th Rd
- 150-13 118th Ave
- 15013 118th Ave
- 15333 119th Rd
- 15042 116th Ave
- 155-18 116th Rd
- 116-45 148th St
- 15313 118th Ave
- 15311 118th Ave
- 153-13 118th Ave
- 15315 118th Ave
- 15317 118th Ave
- 153-11 118th Ave
- 15309 118th Ave
- 153-09 118th Ave
- 15319 118th Ave
- 15307 118th Ave
- 15321 118th Ave
- 15305 118th Ave
- 15321 118th Ave
- 15303 118th Ave
- 15323 118th Ave
- 15303 118th Ave
- 15303 118th Ave
- 15301 118th Ave
- 15325 118th Ave
- 153-25 118th Ave