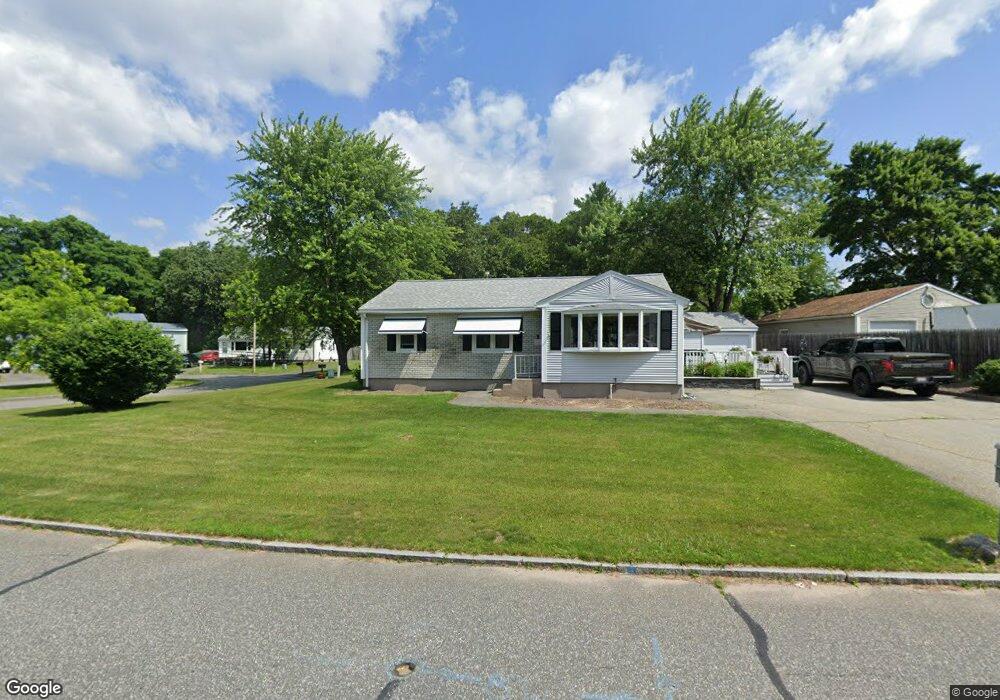
154 Keddy St Springfield, MA 01109
Sixteen Acres NeighborhoodEstimated Value: $246,000 - $295,560
3
Beds
1
Bath
1,011
Sq Ft
$274/Sq Ft
Est. Value
About This Home
This home is located at 154 Keddy St, Springfield, MA 01109 and is currently estimated at $277,140, approximately $274 per square foot. 154 Keddy St is a home located in Hampden County with nearby schools including Frank H. Freedman School, John J Duggan Middle, and Springfield High School of Science and Technology.
Ownership History
Date
Name
Owned For
Owner Type
Purchase Details
Closed on
Jun 28, 2021
Sold by
Granger Cecelia M
Bought by
Granger Gregory A
Current Estimated Value
Purchase Details
Closed on
May 17, 1973
Bought by
Granger Armand P and Granger Cecelia M
Create a Home Valuation Report for This Property
The Home Valuation Report is an in-depth analysis detailing your home's value as well as a comparison with similar homes in the area
Home Values in the Area
Average Home Value in this Area
Purchase History
| Date | Buyer | Sale Price | Title Company |
|---|---|---|---|
| Granger Gregory A | -- | None Available | |
| Granger Armand P | $21,200 | -- |
Source: Public Records
Mortgage History
| Date | Status | Borrower | Loan Amount |
|---|---|---|---|
| Previous Owner | Granger Armand P | $107,000 | |
| Previous Owner | Granger Armand P | $90,000 | |
| Previous Owner | Granger Armand P | $12,200 | |
| Previous Owner | Granger Armand P | $57,000 |
Source: Public Records
Tax History Compared to Growth
Tax History
| Year | Tax Paid | Tax Assessment Tax Assessment Total Assessment is a certain percentage of the fair market value that is determined by local assessors to be the total taxable value of land and additions on the property. | Land | Improvement |
|---|---|---|---|---|
| 2025 | $3,481 | $222,000 | $51,400 | $170,600 |
| 2024 | $3,373 | $210,000 | $51,400 | $158,600 |
| 2023 | $3,253 | $190,800 | $48,900 | $141,900 |
| 2022 | $3,043 | $161,700 | $48,900 | $112,800 |
| 2021 | $3,003 | $158,900 | $44,500 | $114,400 |
| 2020 | $2,748 | $140,700 | $44,500 | $96,200 |
| 2019 | $2,655 | $134,900 | $44,500 | $90,400 |
| 2018 | $2,400 | $125,000 | $44,500 | $80,500 |
| 2017 | $2,575 | $131,000 | $49,200 | $81,800 |
| 2016 | $2,402 | $122,200 | $49,200 | $73,000 |
| 2015 | $2,378 | $120,900 | $49,200 | $71,700 |
Source: Public Records
Map
Nearby Homes