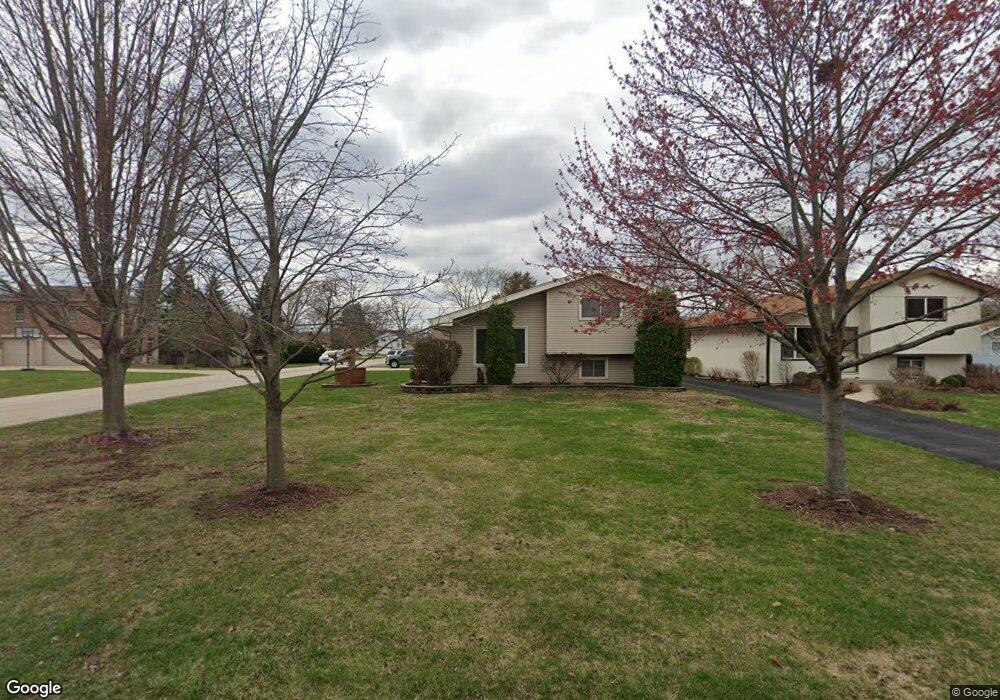
154 N Cedar Ave Wood Dale, IL 60191
Estimated Value: $332,000 - $413,000
3
Beds
2
Baths
1,607
Sq Ft
$227/Sq Ft
Est. Value
About This Home
This home is located at 154 N Cedar Ave, Wood Dale, IL 60191 and is currently estimated at $365,327, approximately $227 per square foot. 154 N Cedar Ave is a home located in DuPage County with nearby schools including Oakbrook Elementary School, Westview Elementary School, and Wood Dale Junior High School.
Ownership History
Date
Name
Owned For
Owner Type
Purchase Details
Closed on
Sep 19, 2017
Sold by
Krozel Richard and Dorynek Krozel Edyta Maria
Bought by
Krozel Richard and Trust Number One
Current Estimated Value
Purchase Details
Closed on
May 28, 2003
Sold by
Gulotta Gregory S and Gulotta Linda R
Bought by
Krozel Richard
Home Financials for this Owner
Home Financials are based on the most recent Mortgage that was taken out on this home.
Original Mortgage
$187,200
Outstanding Balance
$79,499
Interest Rate
5.36%
Mortgage Type
Purchase Money Mortgage
Estimated Equity
$285,828
Purchase Details
Closed on
Mar 11, 1994
Sold by
Sinagra Gary R and Sinagra Jolanta
Bought by
Gulotta Gregory S and Gulotta Linda R
Home Financials for this Owner
Home Financials are based on the most recent Mortgage that was taken out on this home.
Original Mortgage
$116,800
Interest Rate
7.02%
Create a Home Valuation Report for This Property
The Home Valuation Report is an in-depth analysis detailing your home's value as well as a comparison with similar homes in the area
Home Values in the Area
Average Home Value in this Area
Purchase History
| Date | Buyer | Sale Price | Title Company |
|---|---|---|---|
| Krozel Richard | -- | Attorney | |
| Krozel Richard | $234,000 | Atg | |
| Gulotta Gregory S | $146,000 | -- |
Source: Public Records
Mortgage History
| Date | Status | Borrower | Loan Amount |
|---|---|---|---|
| Open | Krozel Richard | $187,200 | |
| Previous Owner | Gulotta Gregory S | $116,800 |
Source: Public Records
Tax History Compared to Growth
Tax History
| Year | Tax Paid | Tax Assessment Tax Assessment Total Assessment is a certain percentage of the fair market value that is determined by local assessors to be the total taxable value of land and additions on the property. | Land | Improvement |
|---|---|---|---|---|
| 2024 | $6,723 | $101,470 | $51,094 | $50,376 |
| 2023 | $6,285 | $93,280 | $46,970 | $46,310 |
| 2022 | $6,309 | $90,120 | $45,380 | $44,740 |
| 2021 | $5,982 | $86,320 | $43,470 | $42,850 |
| 2020 | $5,588 | $82,680 | $41,640 | $41,040 |
| 2019 | $5,420 | $79,500 | $40,040 | $39,460 |
| 2018 | $5,263 | $76,730 | $39,260 | $37,470 |
| 2017 | $5,086 | $73,330 | $37,520 | $35,810 |
| 2016 | $4,846 | $67,700 | $34,640 | $33,060 |
| 2015 | $4,683 | $62,540 | $32,000 | $30,540 |
| 2014 | $4,482 | $59,840 | $31,350 | $28,490 |
| 2013 | $4,459 | $61,060 | $31,990 | $29,070 |
Source: Public Records
Map
Nearby Homes
- 171 N Elmwood Ave
- 213 Hiawatha Trail
- 130 E Potter St
- 294 Oak Ave
- 139 N Hemlock Ave
- 174 Ash Ave
- 337 Oak Ave
- 341 Oak Ave
- 236 Oakwood Dr
- 128 W Irving Park Rd
- 317 N Central Ave
- 367 Catalpa Ave
- 190 S Wood Dale Rd Unit 200
- 440 E Montrose Ave Unit 107
- 440 E Montrose Ave Unit 106
- 440 E Montrose Ave Unit 402
- 467 Hiawatha Trail Unit 201
- 467 Hiawatha Trail Unit 411
- 401 N Wood Dale Rd
- 373 N Hemlock Ave