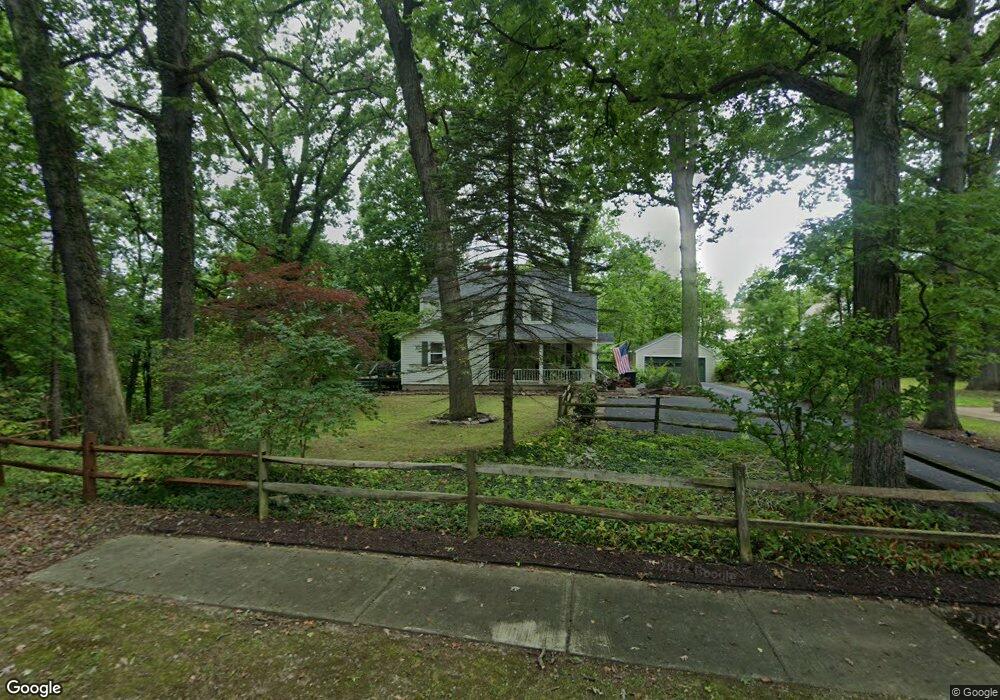
154 Whitney Ave S Unit 156 Youngstown, OH 44509
Schenley NeighborhoodEstimated Value: $67,000 - $129,865
4
Beds
2
Baths
1,910
Sq Ft
$51/Sq Ft
Est. Value
About This Home
This home is located at 154 Whitney Ave S Unit 156, Youngstown, OH 44509 and is currently estimated at $96,966, approximately $50 per square foot. 154 Whitney Ave S Unit 156 is a home located in Mahoning County with nearby schools including Kirkmere Elementary School, Chaney High School, and Summit Academy - Youngstown.
Ownership History
Date
Name
Owned For
Owner Type
Purchase Details
Closed on
Apr 17, 2024
Sold by
Budny Joseph E
Bought by
Budny Joseph E
Current Estimated Value
Purchase Details
Closed on
Feb 16, 2024
Bought by
Joseph E Budny
Purchase Details
Closed on
Jul 7, 2022
Sold by
Budny Wayne E
Bought by
Budny Kimberly A
Purchase Details
Closed on
Jul 6, 2022
Bought by
Budny Joseph E
Purchase Details
Closed on
Jun 27, 2022
Sold by
Budny Kimberly A
Bought by
Budny Joseph E
Purchase Details
Closed on
Aug 4, 1999
Sold by
Waller Suzanne M
Bought by
Moore Gary L
Home Financials for this Owner
Home Financials are based on the most recent Mortgage that was taken out on this home.
Original Mortgage
$52,556
Interest Rate
7.68%
Purchase Details
Closed on
Oct 1, 1987
Bought by
Waller Suzanne M
Create a Home Valuation Report for This Property
The Home Valuation Report is an in-depth analysis detailing your home's value as well as a comparison with similar homes in the area
Home Values in the Area
Average Home Value in this Area
Purchase History
| Date | Buyer | Sale Price | Title Company |
|---|---|---|---|
| Budny Joseph E | -- | None Listed On Document | |
| Joseph E Budny | -- | -- | |
| Budny Kimberly A | -- | -- | |
| Budny Joseph E | -- | -- | |
| Budny Joseph E | -- | None Listed On Document | |
| Moore Gary L | $53,000 | -- | |
| Waller Suzanne M | $30,000 | -- |
Source: Public Records
Mortgage History
| Date | Status | Borrower | Loan Amount |
|---|---|---|---|
| Previous Owner | Moore Gary L | $52,556 |
Source: Public Records
Tax History Compared to Growth
Tax History
| Year | Tax Paid | Tax Assessment Tax Assessment Total Assessment is a certain percentage of the fair market value that is determined by local assessors to be the total taxable value of land and additions on the property. | Land | Improvement |
|---|---|---|---|---|
| 2024 | $1,225 | $25,060 | $2,240 | $22,820 |
| 2023 | $1,216 | $25,060 | $2,240 | $22,820 |
| 2022 | $1,139 | $18,330 | $2,210 | $16,120 |
| 2021 | $1,139 | $18,330 | $2,210 | $16,120 |
| 2020 | $1,162 | $18,330 | $2,210 | $16,120 |
| 2019 | $1,121 | $16,080 | $1,940 | $14,140 |
| 2018 | $1,132 | $16,080 | $1,940 | $14,140 |
| 2017 | $1,129 | $16,080 | $1,940 | $14,140 |
| 2016 | $1,408 | $21,600 | $3,070 | $18,530 |
| 2015 | $1,379 | $21,600 | $3,070 | $18,530 |
| 2014 | $1,369 | $21,600 | $3,070 | $18,530 |
| 2013 | $1,350 | $21,600 | $3,070 | $18,530 |
Source: Public Records
Map
Nearby Homes
- 120 Whitney Ave S
- 1651 Price Rd
- 1595 2nd St
- 1594 2nd St
- 234 S Portland Ave
- 60 Steel St
- 15 S Portland Ave
- 1751 Mahoning Ave
- 1611 Wellington Ave
- 219 N Maryland Ave
- 1711 Wellington Ave
- 804 S Belle Vista Ave
- 77 Fernwood Ave
- 1516 Midland Ave
- 1944 Overlook Ave
- 406 Breaden St
- 1835 Mccollum Rd
- 1726 Midland Ave
- 134 Millet Ave
- 61 S Hartford Ave
- 148 Whitney Ave S
- 157 Halls Heights Ave
- 142 Whitney Ave S
- 147 Halls Heights Ave
- 143 Halls Heights Ave
- 140 Whitney Ave S
- 139 Halls Heights Ave
- 134 Whitney Ave S
- 135 Halls Heights Ave
- 143 Whitney Ave S
- 154 Halls Heights Ave
- 130 Whitney Ave S
- 152 Halls Heights Ave
- 144 Halls Heights Ave
- 129 Halls Heights Ave
- 138 Halls Heights Ave
- 129 Whitney Ave S
- 128 Whitney Ave S
- 121 Halls Heights Ave
- 134 Halls Heights Ave